![How to analyze multiple charts at the same time? [Forex Strategy]](/api/v1/main/image/02097774-4c39-4542-a2dd-2834ebf714f4)
Analyzing multiple charts at the same time is like listening to different instruments in a symphony. Each one has its own tone, but only when you hear them together do you understand the full melody. It’s the same in Forex - one chart might suggest a direction, but the others reveal the bigger picture.
Content
Why should we monitor multiple charts?
How to get started: The triple check
Forex strategy for beginners and advanced traders: Combining multiple timeframes
How to avoid the traps?
Forex strategy that leads to consistent profits
Why should we monitor multiple charts?
Let’s be honest - trading using only one timeframe is like driving with your eyes closed. Sure, you might get by for a while, but very quickly you’ll veer off the road.
If you’re wondering, “Can you make money in Forex?” the truth is - yes, but not without seeing the whole picture. A Forex strategy that involves analyzing multiple charts increases your chances of entering the market with accuracy, confidence, and clarity.
How to get started: The triple check
There’s one golden rule I always share with both beginners and advanced traders: “First look at the big picture, then zoom in.” This isn’t poetry - it’s a technical approach:
- Higher timeframe (e.g., daily or 4-hour) – the context. On this timeframe, we look for the trend and key support and resistance zones. Think of it as your navigation before a trip - you wouldn't start the journey without it, right?;
- Medium timeframe (e.g., 1-hour) – the setup. This is where patterns from that indicate the market is starting to find its direction. Is there consilidation? Or maybe a false breakout?;
- Lower timeframe (e.g., 15-minute or 5-minute) – the precise entry. Here, you catch the exact moment. This is where you apply your specific entry rules. If everything aligns with the higher timeframes - you hit the button.
Forex strategy for beginners and advanced traders: Combining multiple timeframes
For beginners, this method can feel like trying to ride a bike and solve an equation at the same time. But with a little practice, it becomes much clearer. Here’s how you can get started:
- Choose a currency pair - it's usually best to start with one of the major pairs traded against the US dollar;
- Watch three timeframes - daily, 1-hour, and 15-minute charts;
- Determine the trend on the daily chart;
- On the 1-hour chart, look for patterns such as flags, breakouts, reversal formations, etc.;
- On the 15-minute chart, wait for a confirmation to enter - for example, long-tailed candles or engulfing patterns.
For more advanced traders, combining multiple timeframes allows you to trade proactively rather than reactively. You can even analyze several currency pairs in parallel, using templates in MetaTrader or TradingView to monitor movements in real time.
USD/JPY example
Let me show you how this looks in practice using a concrete example with the USD/JPY currency pair. This is a setup we tracked in the premium channel, and it developed textbook-perfect.
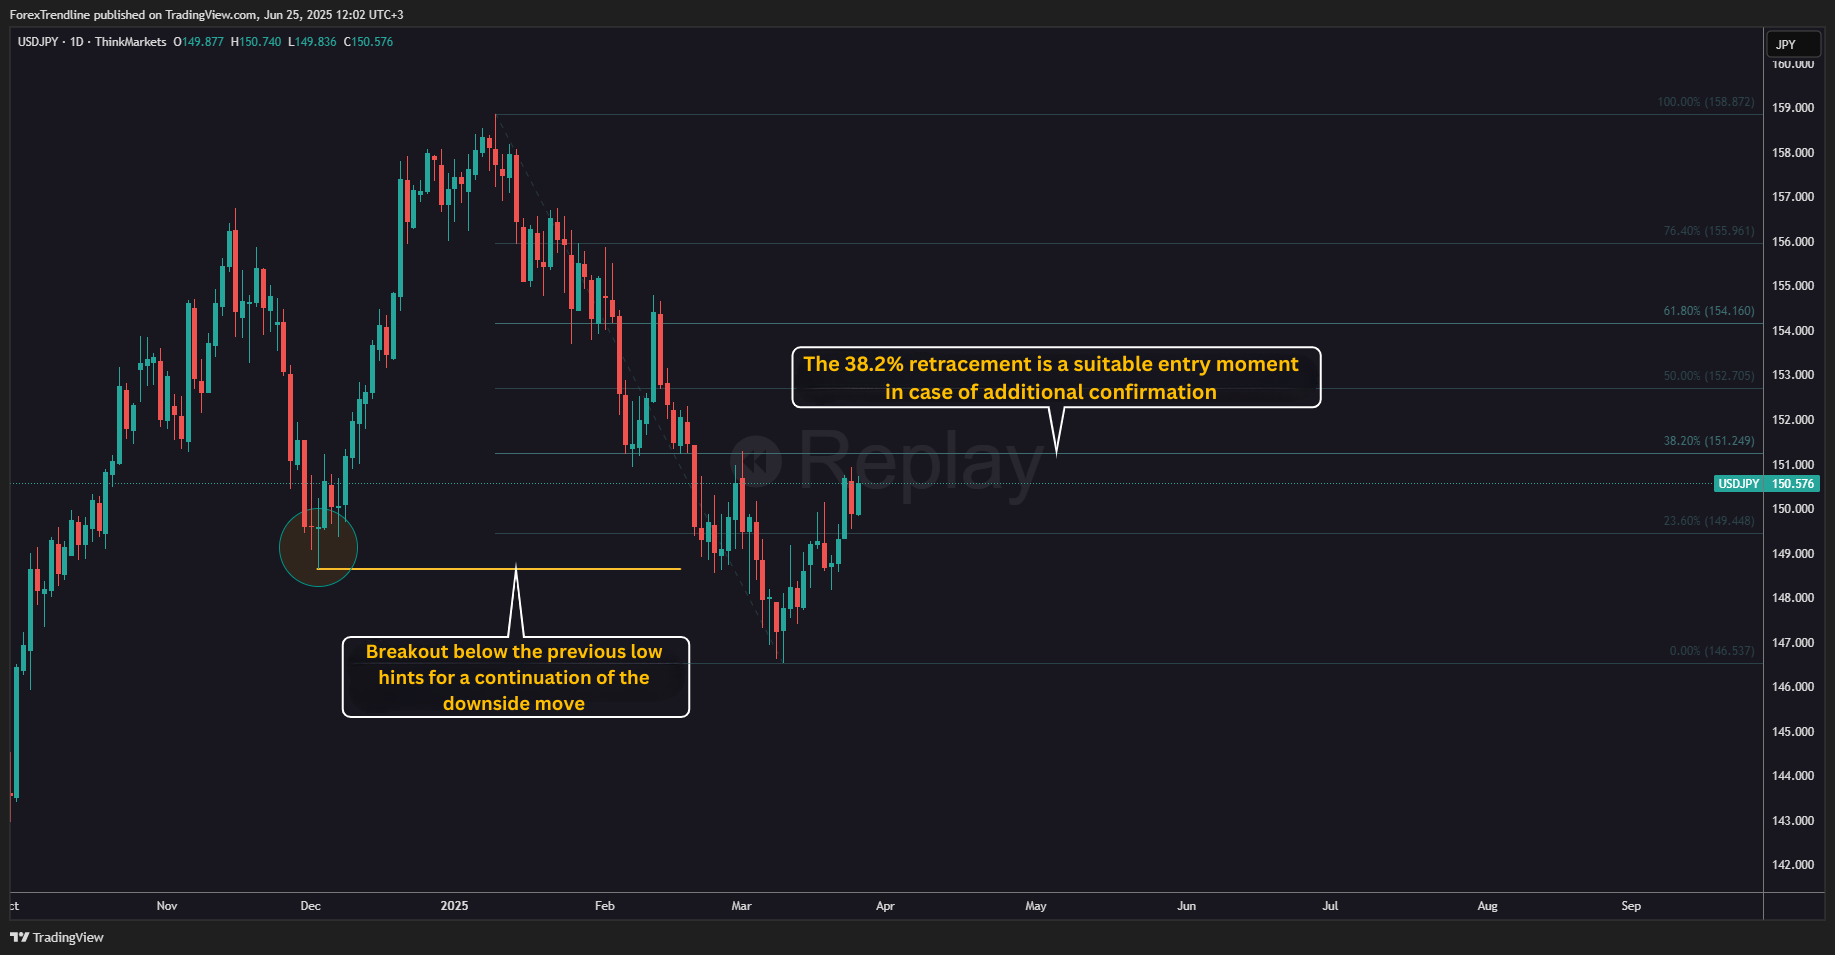
On the daily chart, a clear downtrend stands out. This should immediately direct your attention to potential short positions. Using the Fibonacci retracement tool, you can mark key zones where price reactions are likely - usually between 38.2% and 61.8%.
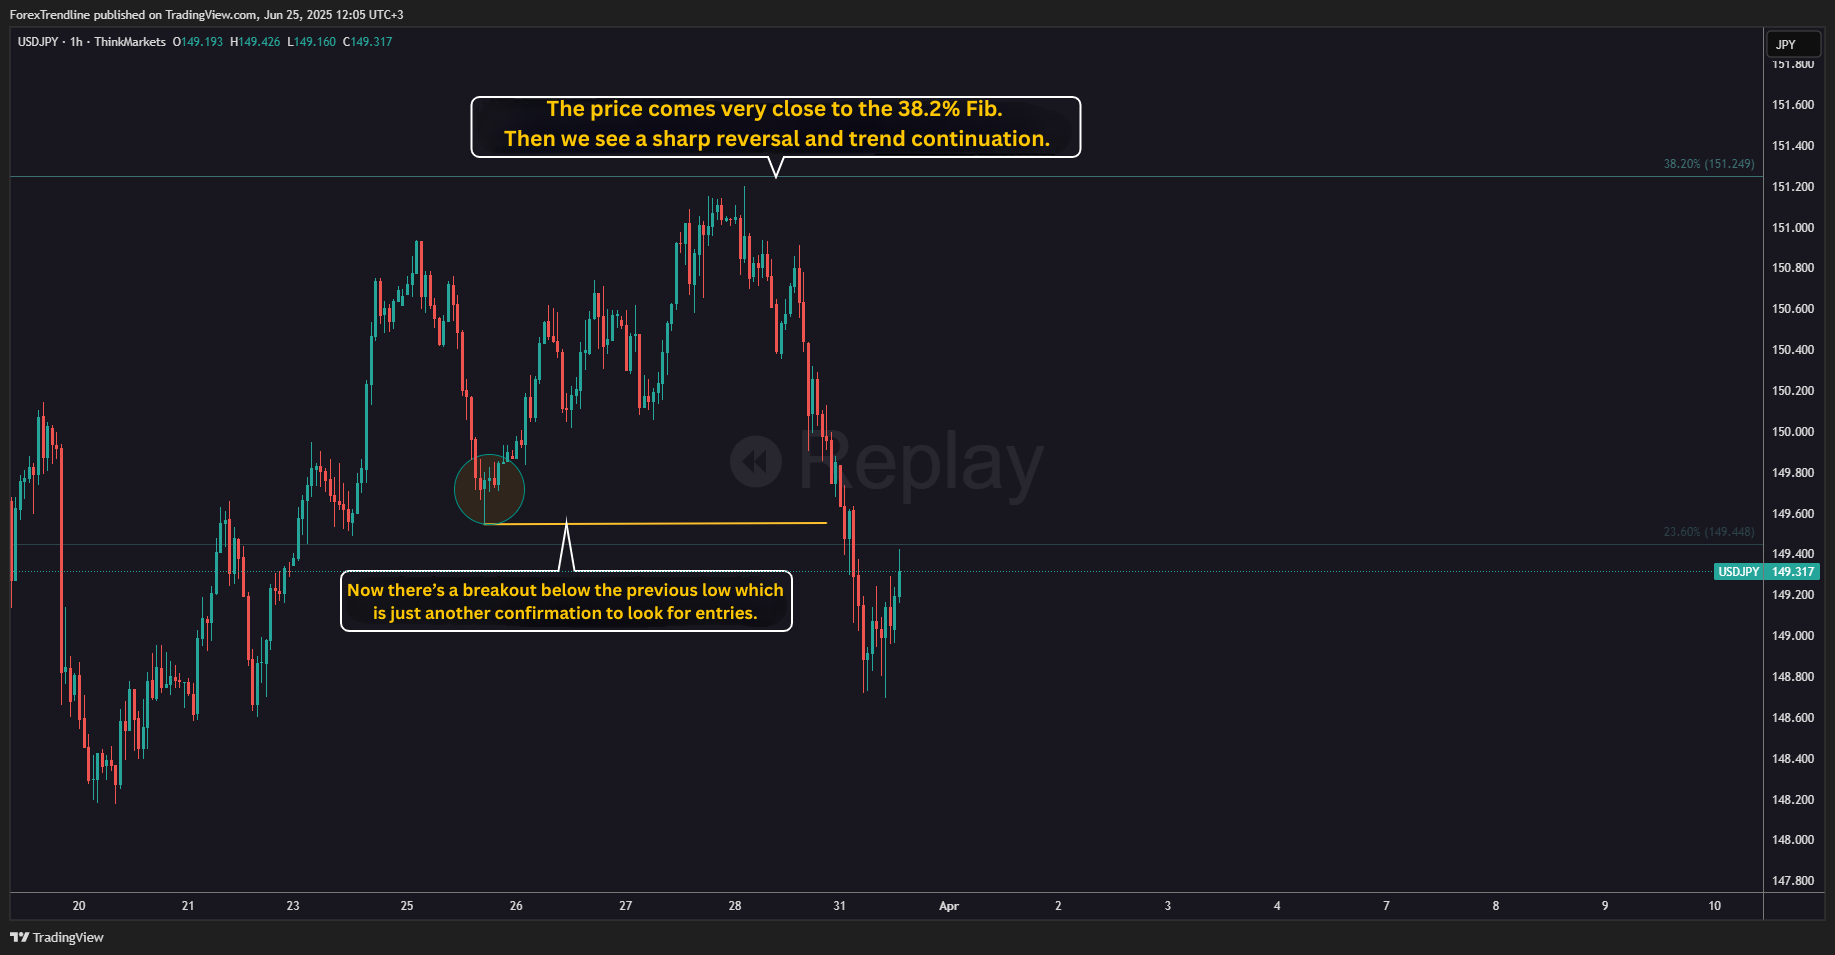
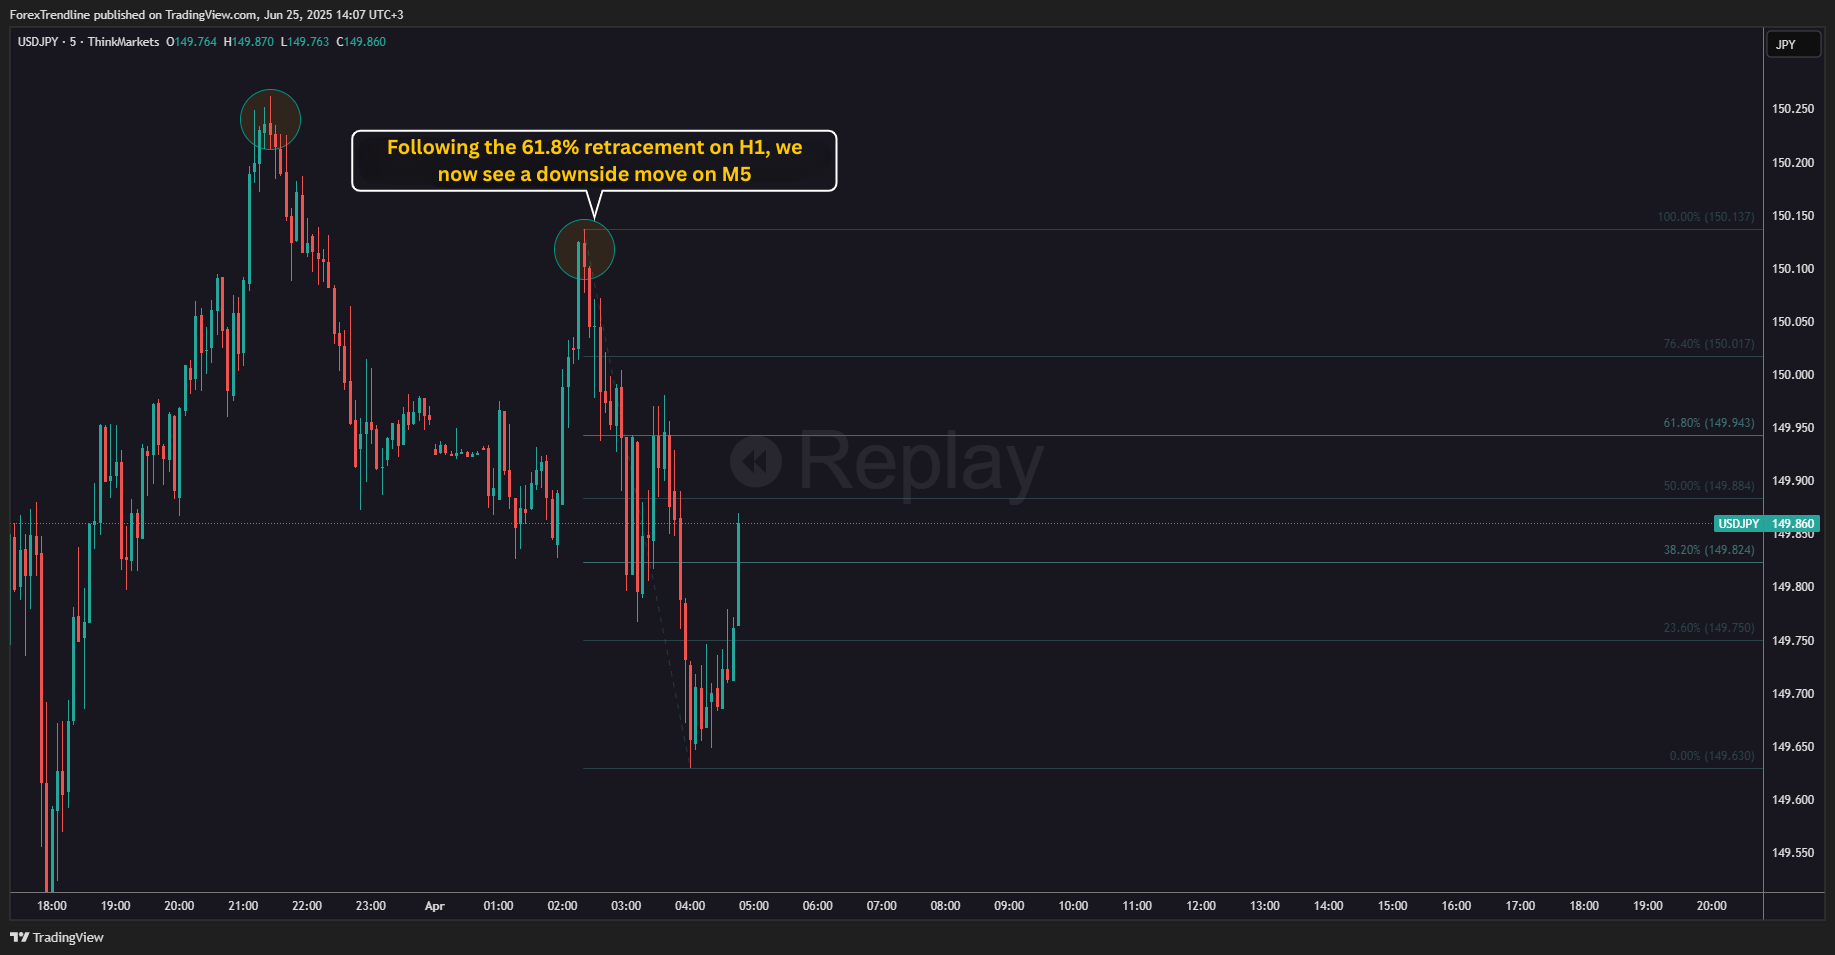
Once you’ve identified the overall direction, it’s time to move to the 1-hour chart. Here, you look for additional confirmation - the price forms a new lower low, reinforcing the current downtrend. Interestingly, the market reacts almost exactly around the 38.2% retracement level from the daily chart - another confluence that shouldn’t be overlooked.
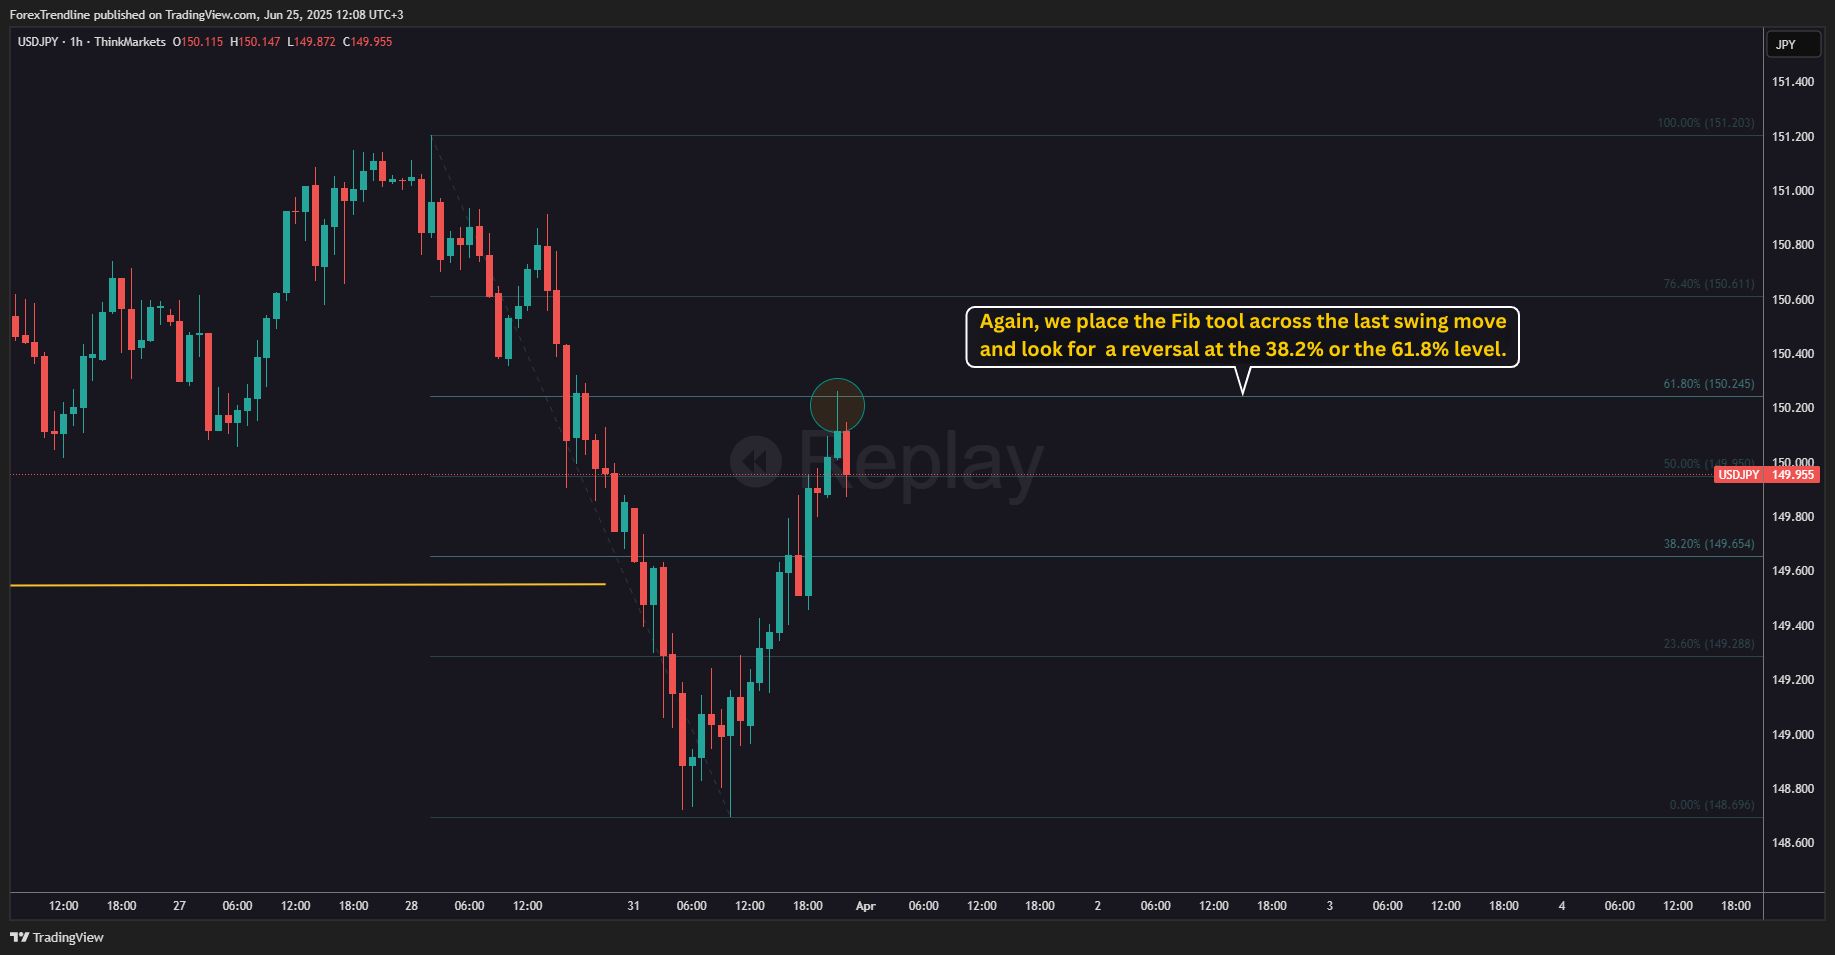
Within the same hour, if you spot a clear impulse in the direction of the trend (in this case, downward), you can apply Fibonacci again - this time to the impulse itself. This gives you more precise levels for a potential entry - like fine-tuning your sights before taking the shot.
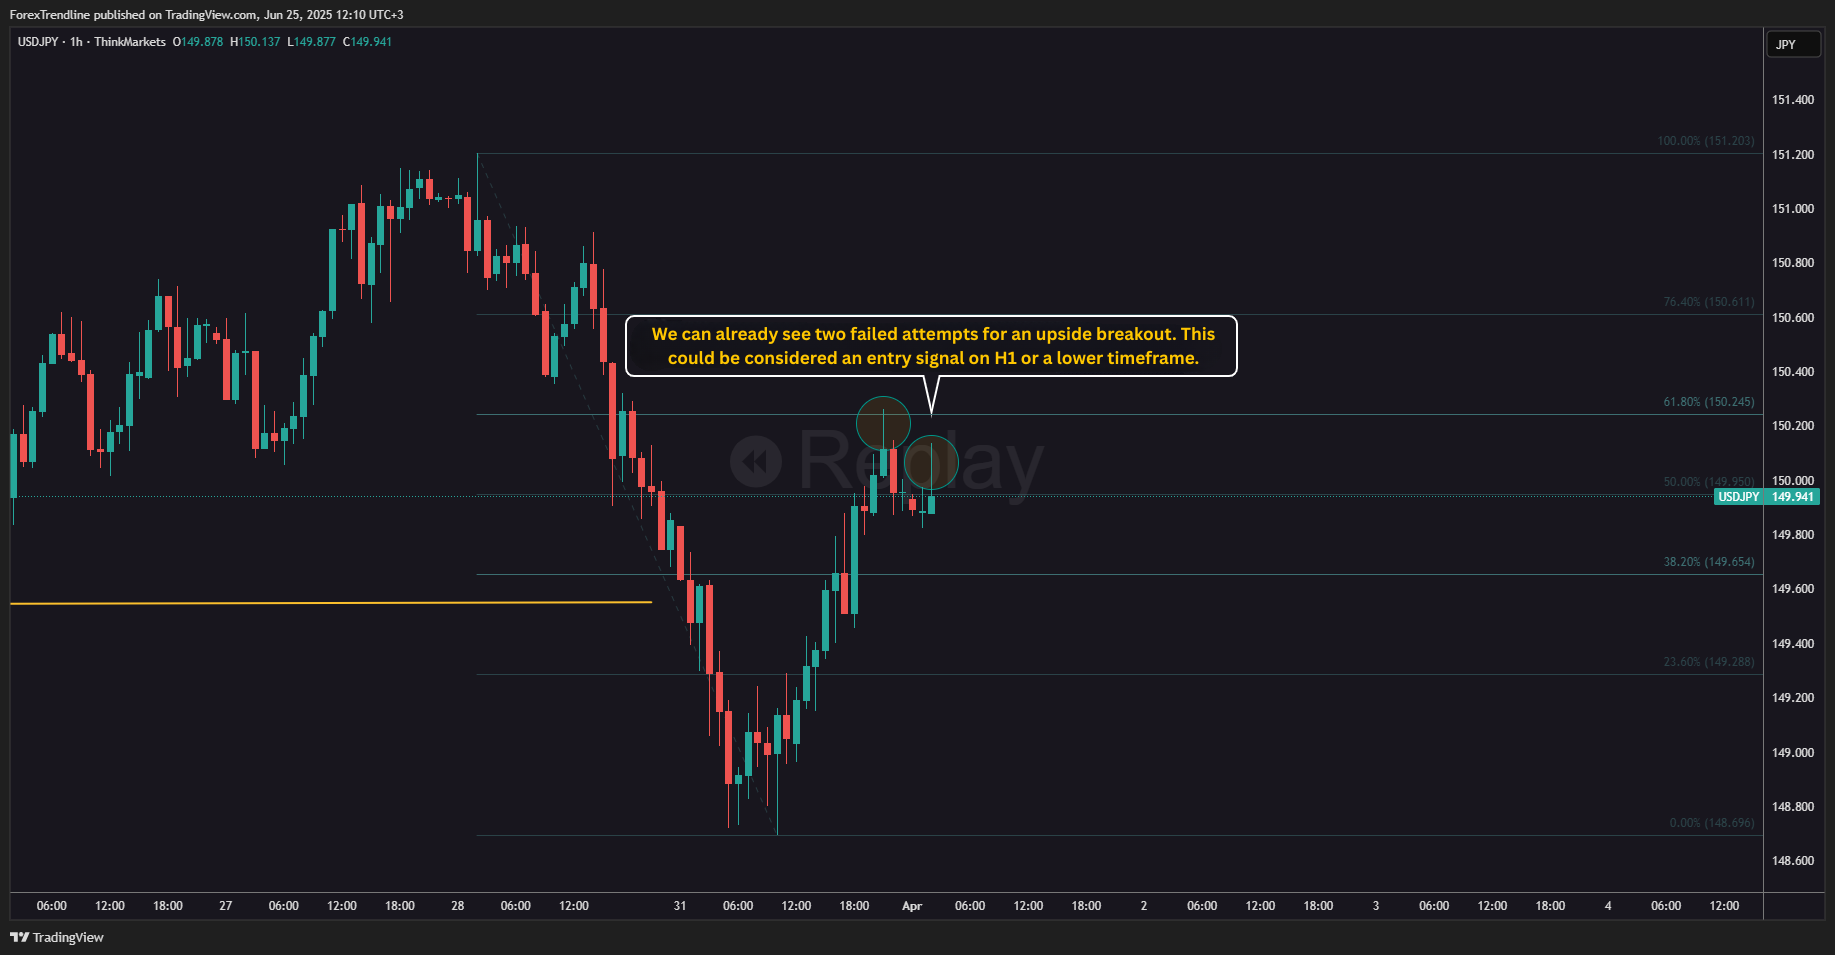
As I mentioned earlier, candles with long wicks pointing against the trend often signal that the correction is running out of steam. The higher the timeframe on which you spot them, the more significant the signal becomes.
If you decide to drop down to an even lower timeframe - say M5 - look for confirmation of everything you’ve already identified on the higher timeframes. This is the moment where you combine the “big picture” with surgical precision.
There’s nothing wrong with using indicators in the beginning. Think of them as your training wheels until you learn to read price action directly. Indicators like moving averages, RSI, or MACD can provide extra context and confidence.
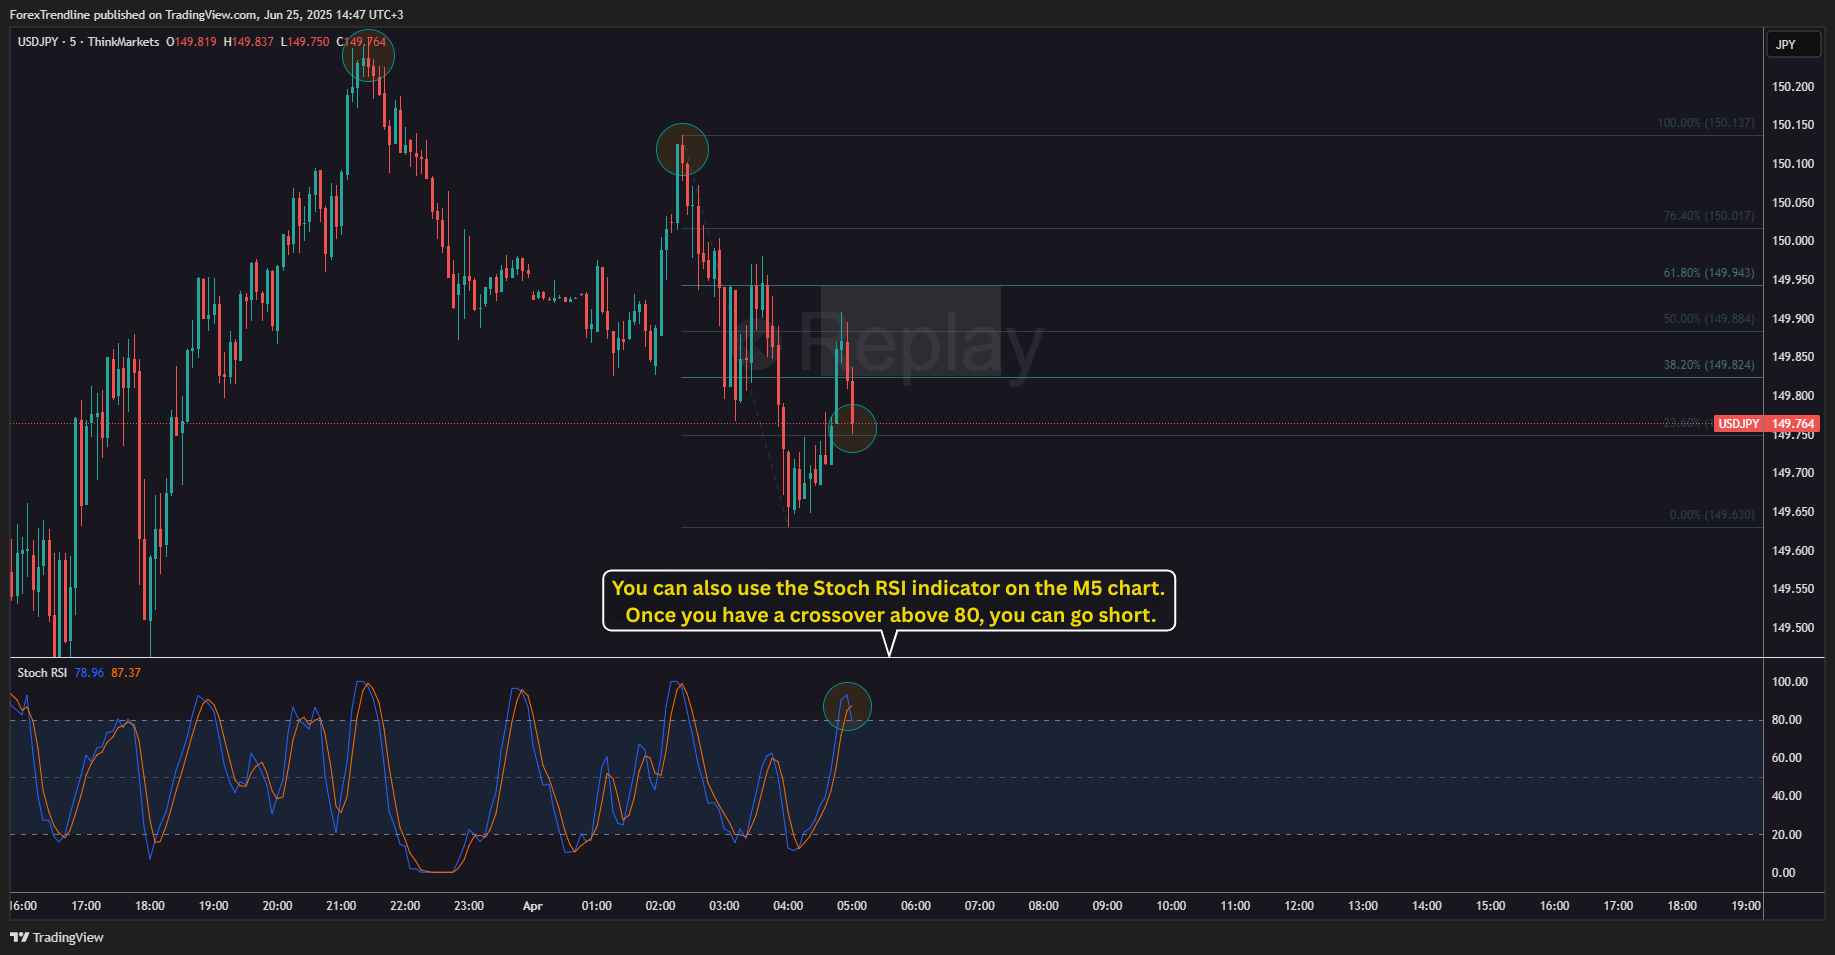
Here’s how the entry for this setup would look on the 5-minute chart. It comes right after the test of the zone between the 38.2% and 61.8% retracement of the impulse. Targets are identified using Fibonacci extension, which in this case are set at the following levels: 149.59, 149.40, and 149.08.
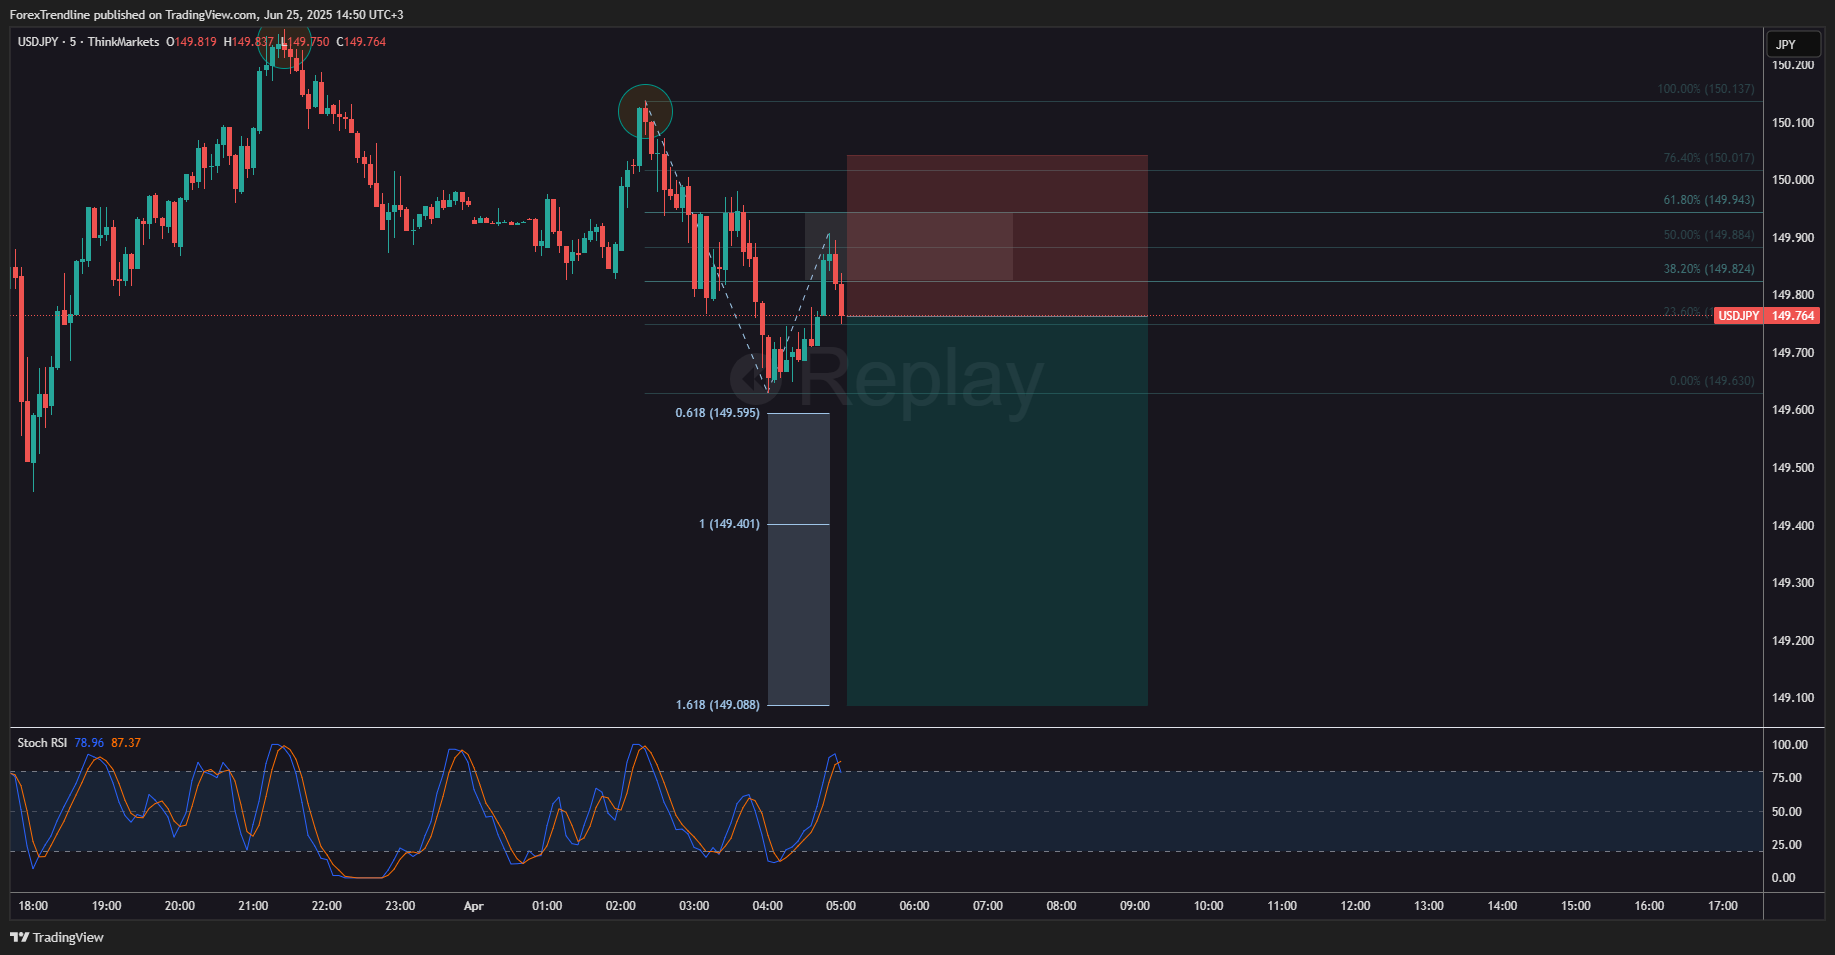
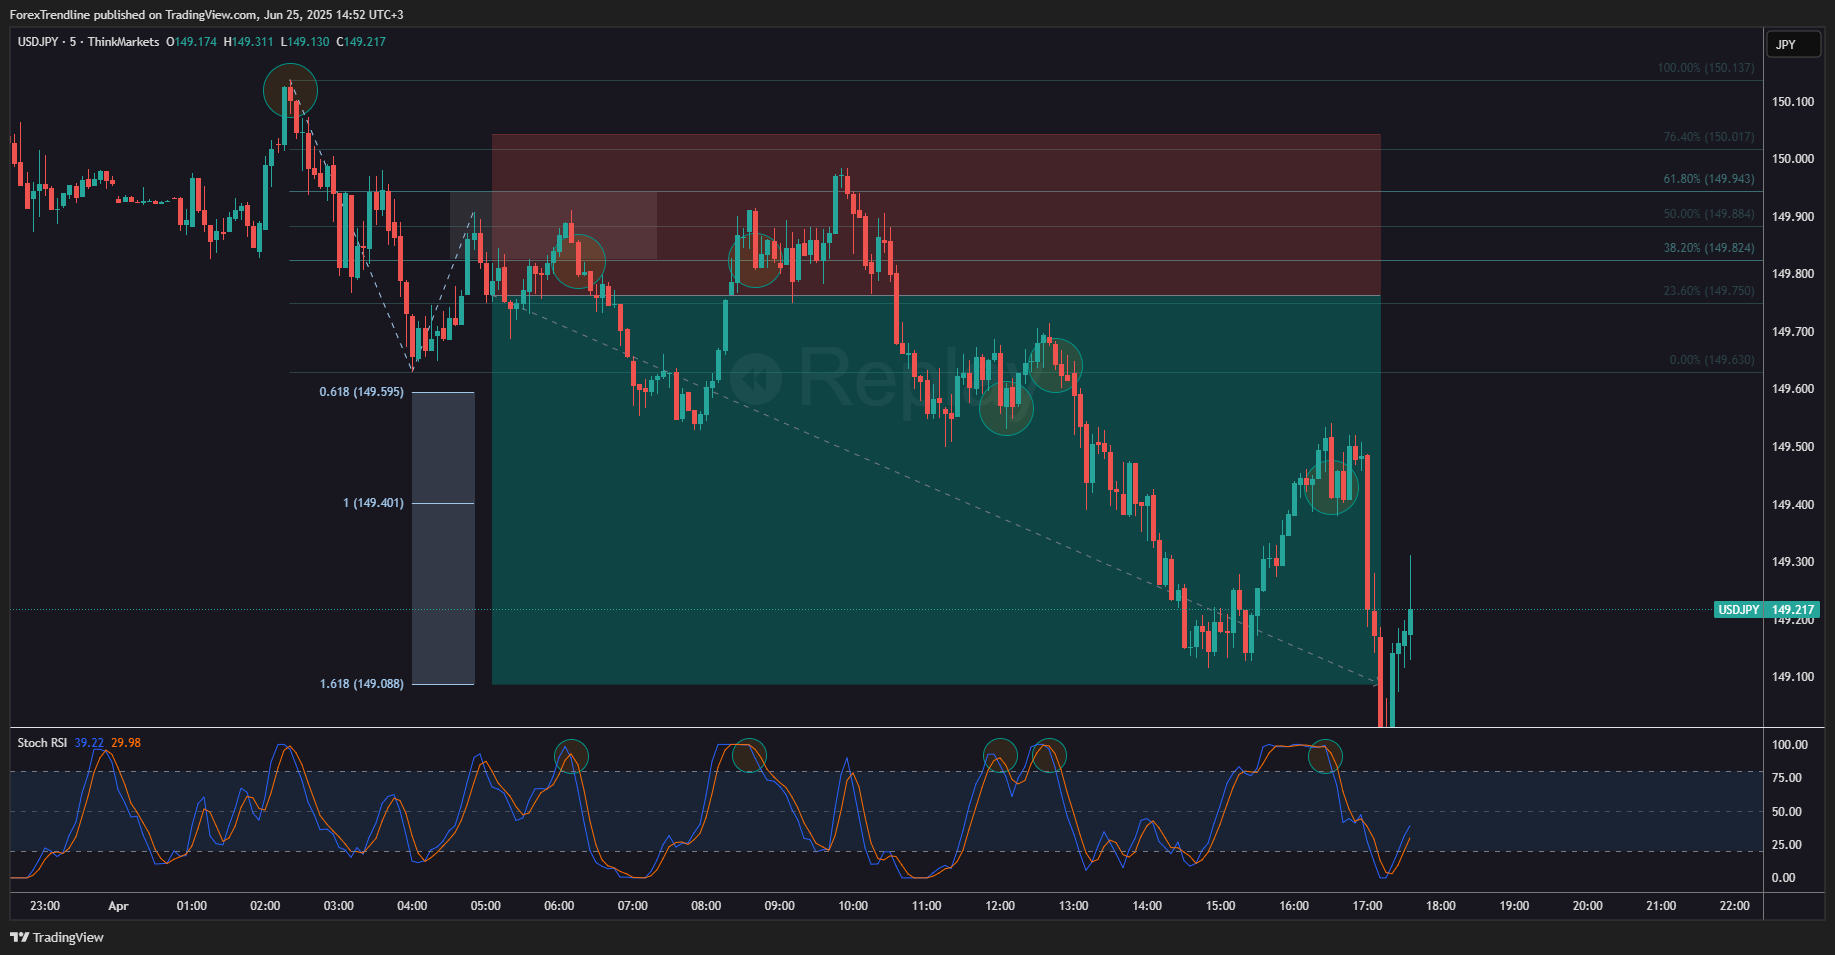
The market reaches the third target with little hesitation. After that, as you can see on the chart, new signals begin to appear in the same direction. With more experience, you can use these secondary setups to add to your existing position - this way you maximize the move’s potential without breaking your trading discipline.
How to avoid the traps?
A common mistake when analyzing multiple charts is getting confused by conflicting signals. This is where the key point comes in: choose a leading timeframe. If you’re trading on the 5- or 15-minute chart, then H1 is your setup, while D1 gives you the direction.
Also, stay away from overloading your charts with indicators. Too much complexity often kills the simplicity of an effective strategy.
Forex strategy that leads to consistent profits
The truth is, consistent profits in Forex don’t come from a magical system, but from habit - disciplined analysis, consistency, and adaptability. Building a routine where you check multiple timeframes before every trade is what separates professionals from gamblers.
Analyzing multiple charts isn’t rocket science, but it’s a lot like surfing - you need to spot the right wave before you jump. The market won’t wait. But you can learn to stay one step ahead.
Don’t ask yourself, “Can I make money in Forex?” Instead, ask, “How well am I preparing for each trade?”
If you want to develop a habit that will improve your trading in the long run - start today. Pick one pair, open three charts, and practice this approach. Trust me, at some point you’ll stop just looking at the market and start actually seeing it.
And for maximum precision in your entries, make use of Fibonacci tools. Learn everything about them, the different types, and how to apply them to your own strategy.
Analyze and trade using “Fibonacci”
The Fibonacci instruments give us some of the most reliable signals in technical analysis, learn how to apply them in your trading and find trades with their help + examples.


Risk Warning: All products and services offered by "Forex Trendline" Ltd are for educational purposes only and do not constitute investment advice or a trading recommendation. Trading financial instruments carries a high level of risk and may result in losses. Past performance is not a guarantee of future success. We recommend that you read the full Terms and Conditions before using our services. Nothing on this site should be interpreted as investment advice from "Forex Trendline" Ltd or any of its representatives, directors, or employees.
© 2025 Trendline. All rights reserved