![How to use TradingView [Detailed guide]](/api/v1/main/image/6bc0a7be-bf1a-49cb-8d8c-2db2c040c70d)
TradingView is one of the most popular platforms for trading and technical analysis.
It offers all the essential tools, charts, and indicators you need for trading.
Whether you're a complete beginner, an advanced trader, or a professional, this guide will help you understand and make the most of the platform’s core features.
In this article, you'll learn how to set up your charts, add indicators, use various analysis tools, and even connect your account so you can place trades directly through TradingView.
Content
TradingView main features
Adding and customizing a chart
Adding indicators
Technical analysis tools
Trading using the TradingView platform
Conclusion and additional resources
TradingView main features
TradingView is one of the most popular platforms for technical analysis, offering a wide range of tools for trading and visualizing market data.
It allows traders to create custom charts, apply indicators, and share their analysis with other users. Thanks to its user-friendly interface and integration with various brokers, TradingView is suitable for both beginners and experienced investors.
Once you open the website and register, you’ll be automatically directed to the homepage, which looks like this:
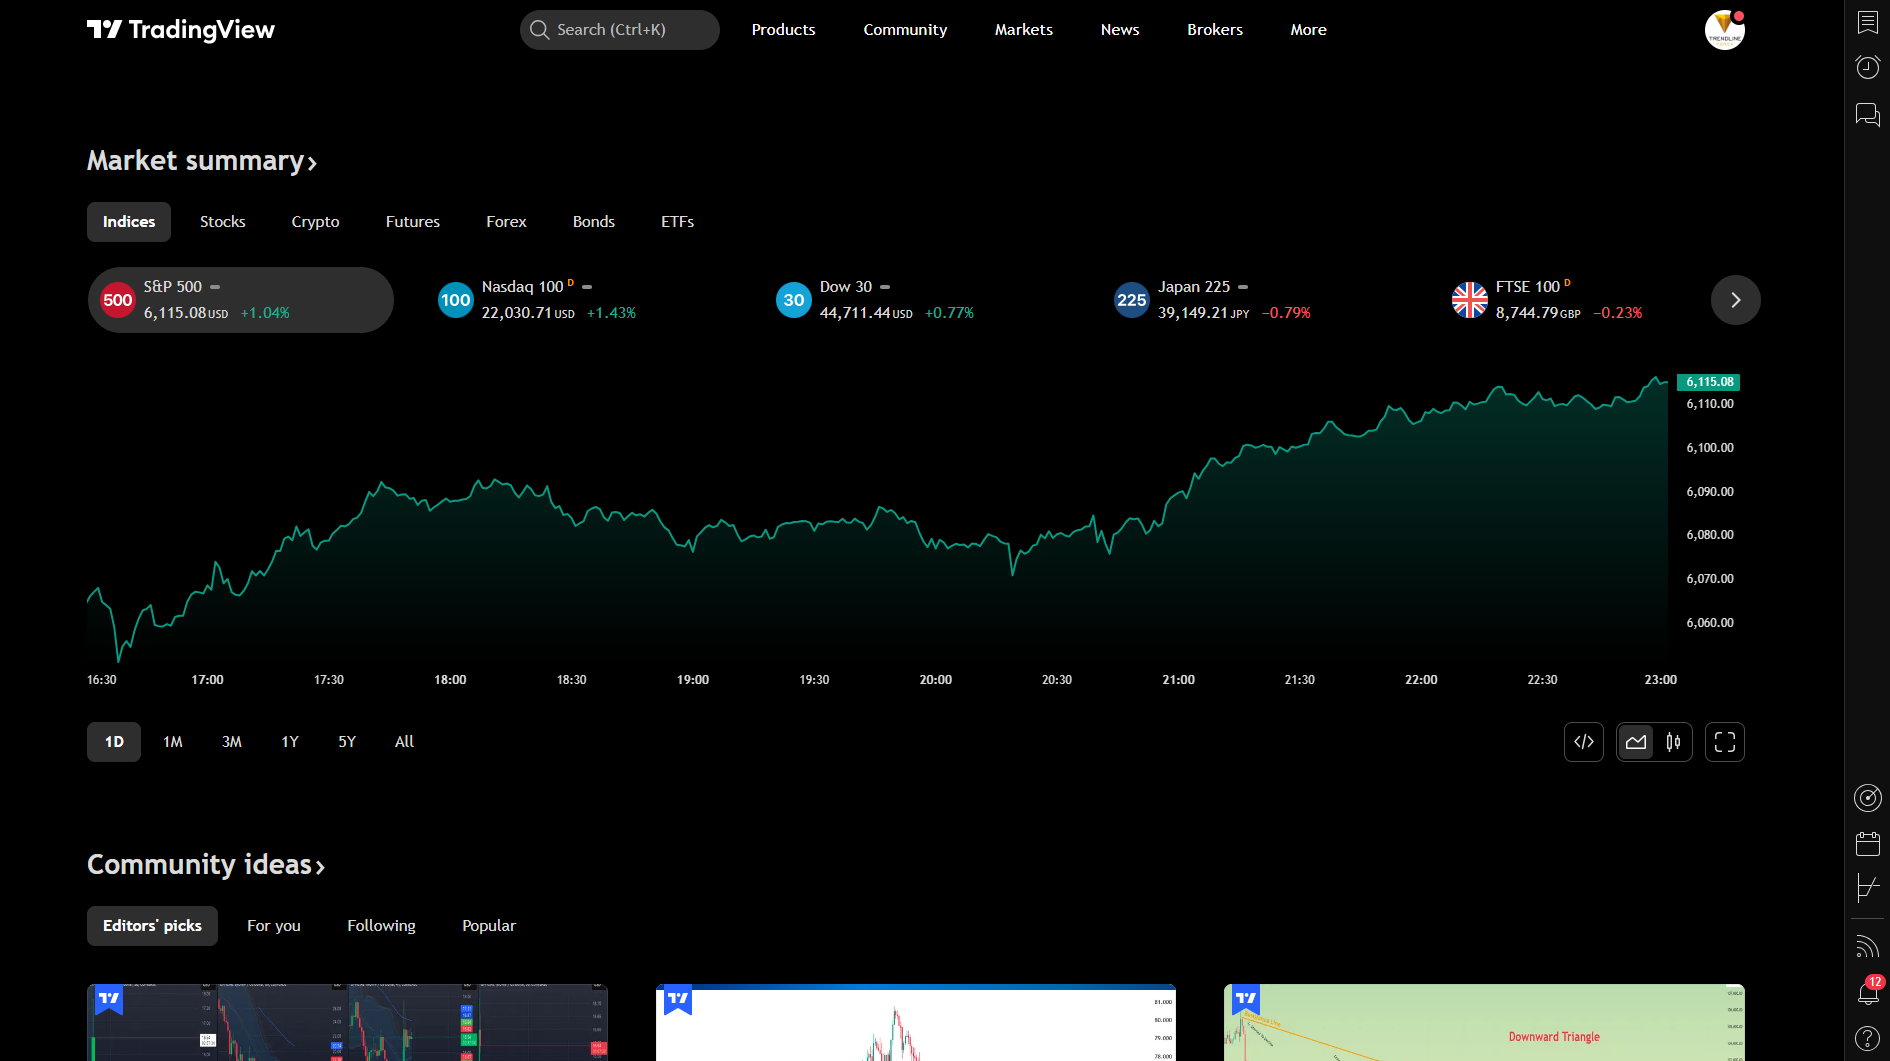
The most important elements on this page are the buttons in the main menu. They are located at the top of the page, to the right of the logo.
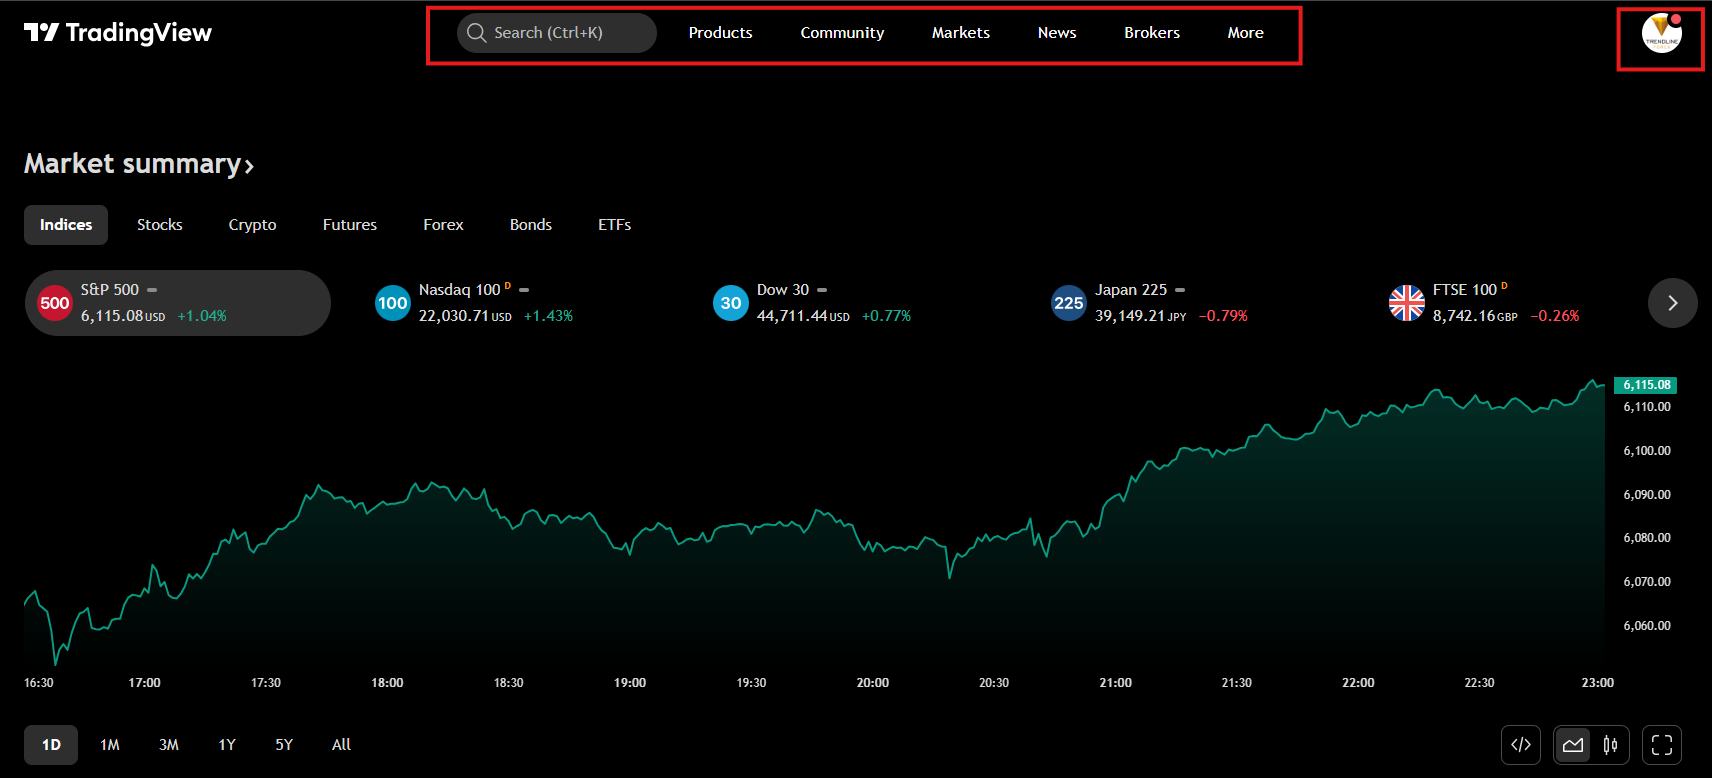
Description of the buttons in the main menu
Products
This section gives you access to various TradingView tools and services, such as the charting platform, trading signals, developer API, and mobile apps.
Community
Here, users can connect with other traders, browse and share analysis, comment on ideas, and follow industry experts.
Markets
The "Markets" section provides information on different financial markets, including stocks, cryptocurrencies, forex, bonds, and indices. You can track trends and analyze price movements here.
News
This is where you'll find the latest economic and market news that could impact your trading decisions. TradingView integrates news from multiple sources to help traders stay informed.
Brokers
In this section, you’ll find a list of supported brokers that can be integrated with TradingView, allowing you to trade directly through the platform.
More
This button contains additional options and settings, including premium plans, the help center, profile settings, and other useful resources to enhance your experience.
The "Profile" menu in TradingView
At the top-right corner of the TradingView platform, you’ll find the profile menu, which provides quick access to your settings, subscription details, and extra features.
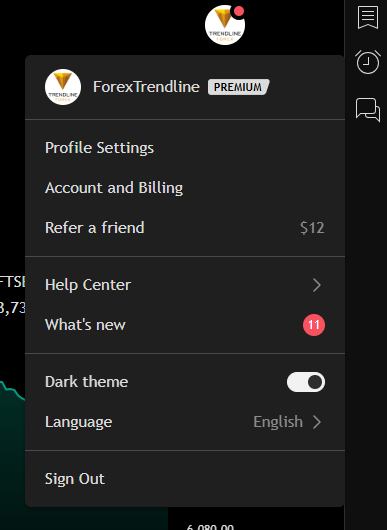
In the image, you can see that we’re using a Premium account, which means we have access to advanced tools, an ad-free experience, more indicators, and other benefits.
Here’s a breakdown of the function of each menu option:
Profile settings
Allows you to update your account information, including your name, profile picture, bio, and other personal details.
Account and billing
From here, you can manage your subscription, including payment history and options to upgrade or cancel your premium plan.
Refer a friend
From here, you can manage your subscription, view your payment history, and choose to upgrade or cancel your premium plan.
Help center
In this section, you can find frequently asked questions, guides, and support for various features of TradingView.
What's new
Displays the latest updates and improvements to the platform. In this case, there are 11 new change notifications.
Dark theme
Here, you can switch between light and dark themes. The dark mode is currently enabled in the image shown.
Language
Allows you to change the platform's language. English is selected at the moment.
Sign out
From here, you can log out of your TradingView account.
This menu is extremely convenient, providing quick access to platform customization, subscription management, settings, and language preferences.
Additional features on the homepage
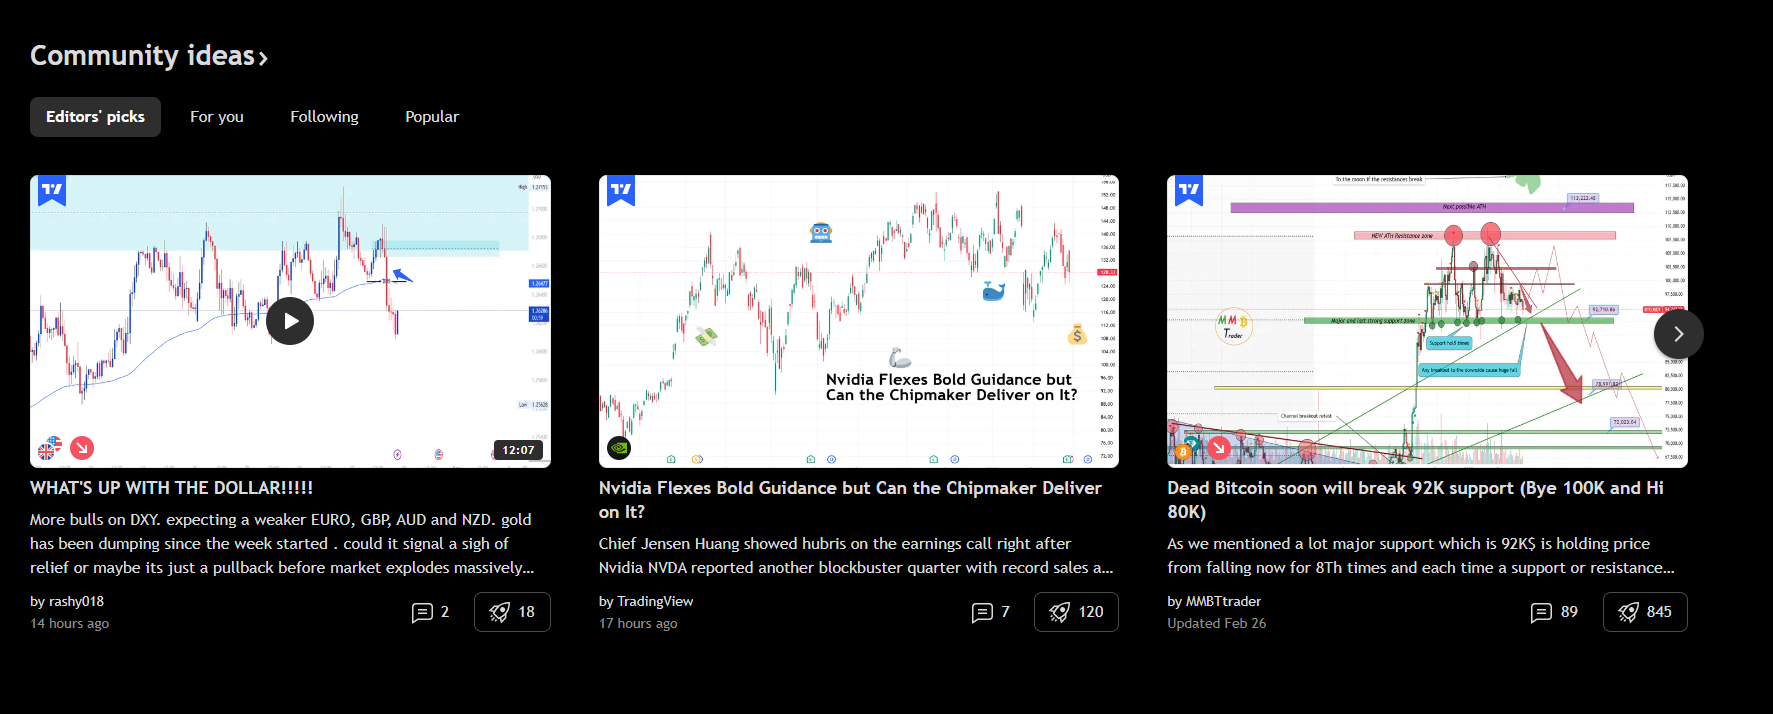
On the TradingView homepage, you can find a variety of content, including:
Trading ideas
Users share both technical and fundamental analysis for various assets such as stocks, currencies, cryptocurrencies, and indices.
Indicators and strategies
New and trending indicators are published, which traders can use to make better trading decisions.
Economic news and events
Information on macroeconomic events, company news, and financial markets.
Real-time stocks and cryptocurrencies
Track market movements, price quotes, and trends.
Charts and technical analysis
Interactive charts that traders can customize to suit their needs.
Adding and customizing a chart
To access the price chart in TradingView, create a watchlist, and analyse the instruments you want to trade, you need to return to the top of the page.
Click on “Products,” then select “Supercharts” from the dropdown menu. This is TradingView’s main tool for technical analysis.
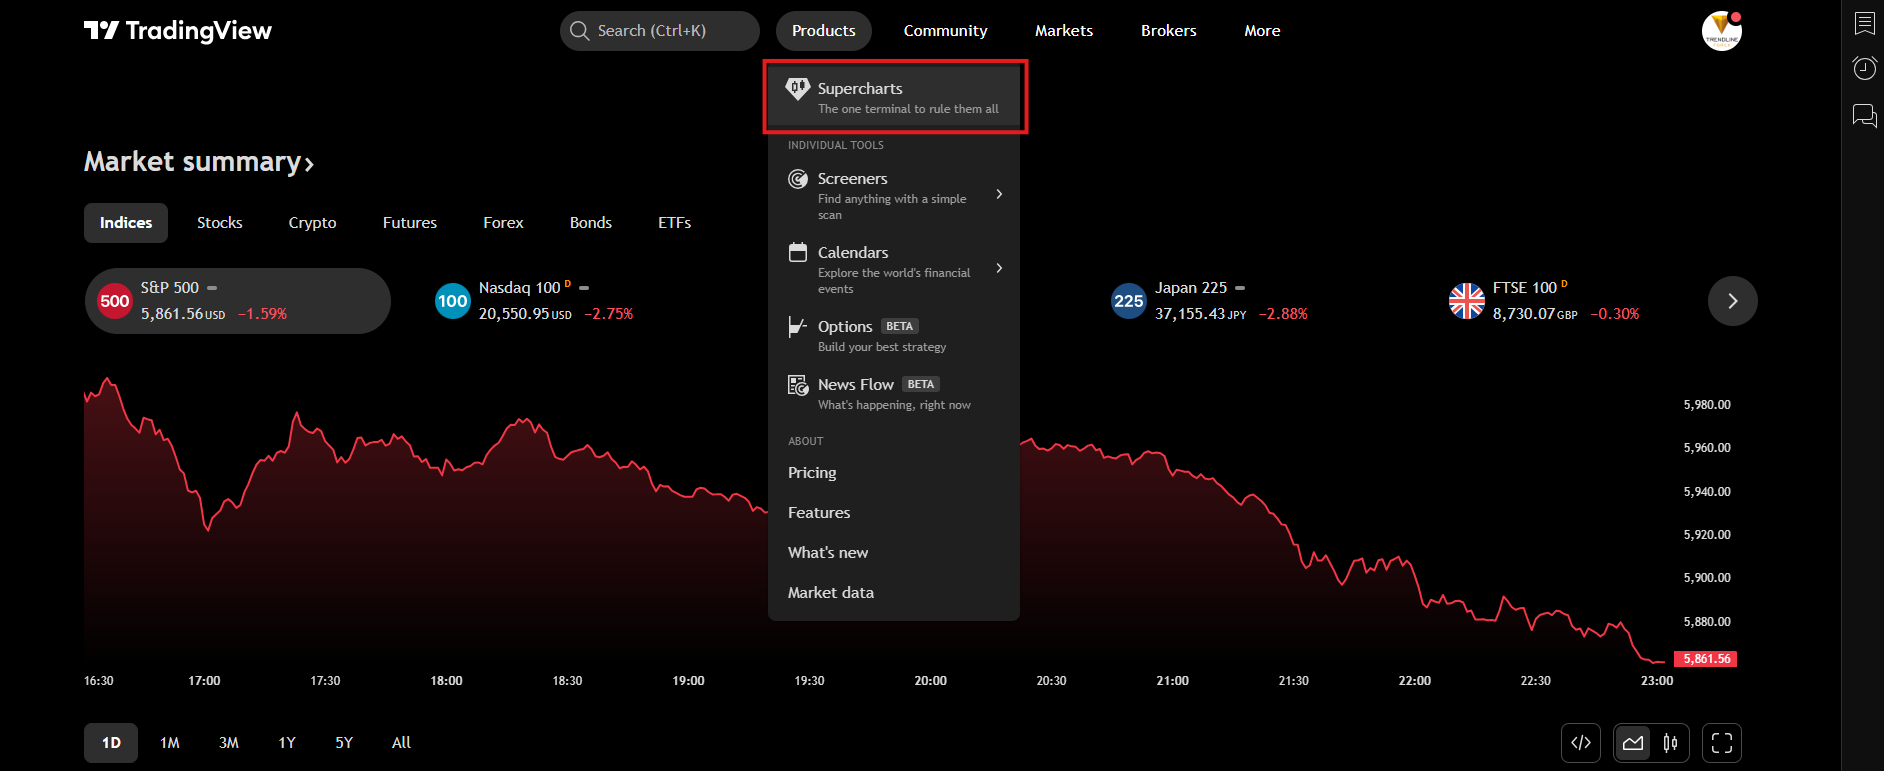
The platform will redirect you to the price chart, which will likely look different from the one shown in the image below.
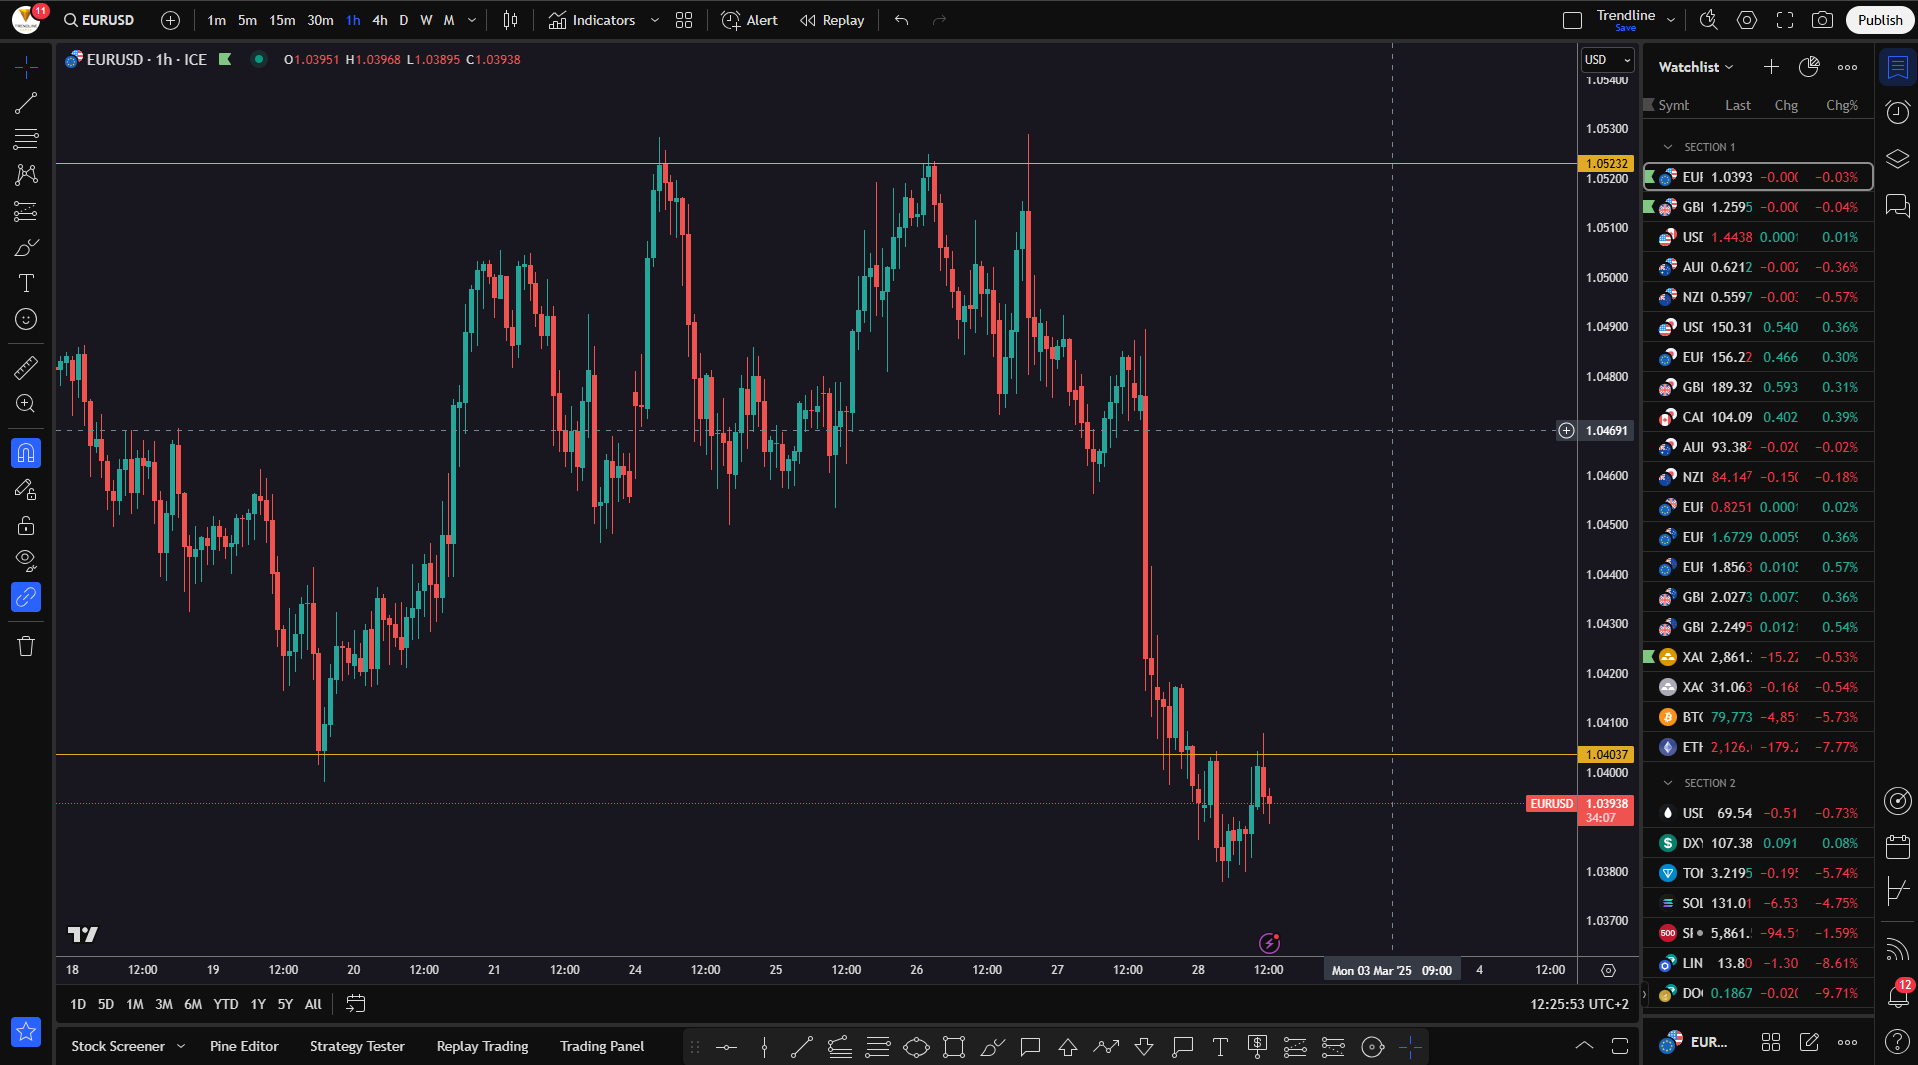
The menus you see in the image will be the same - the toolbar on the left side of the screen, along with additional menus above, below, and beside the chart. We’ll go over each of them in detail, so keep reading.
But first, we suggest customizing the chart layout to suit your preferences. To do this, right-click on an empty area of the price chart.
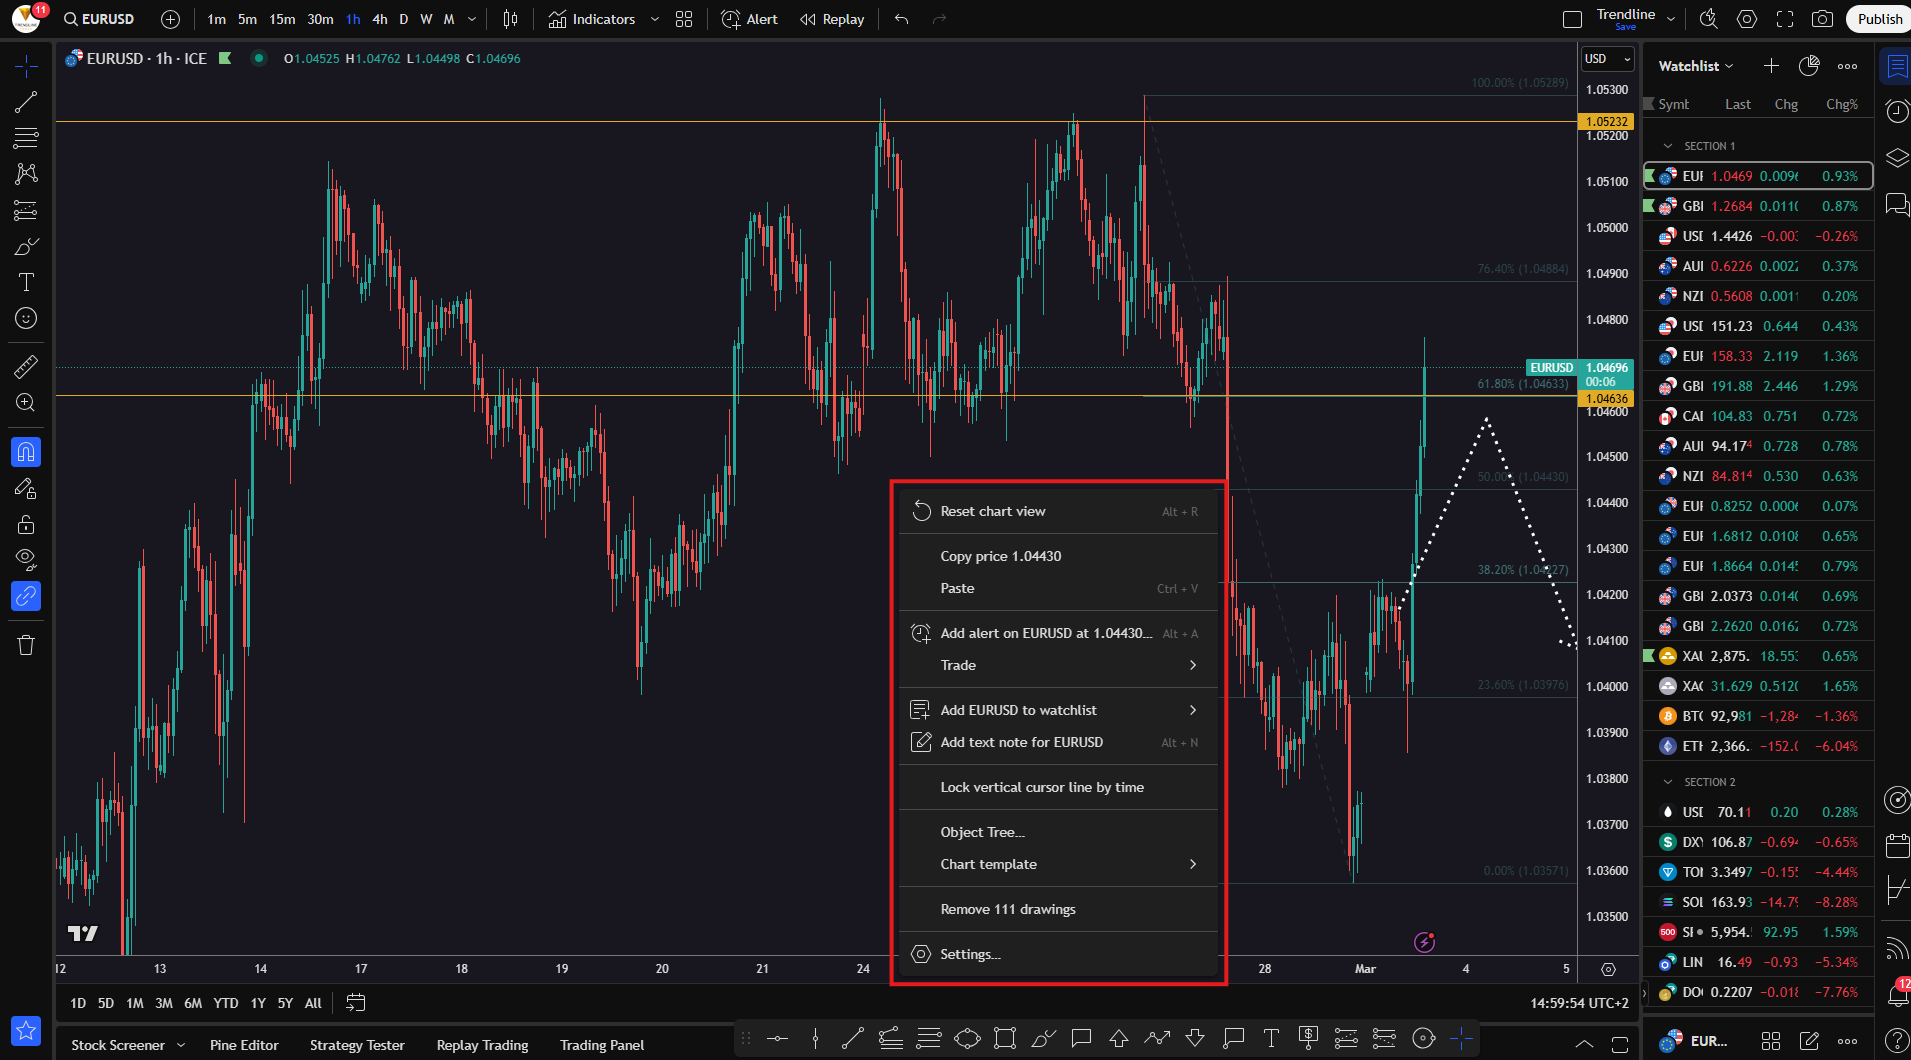
The menu options provided by the platform include the following:
Reset chart view (Alt +R)
Resets the chart to its original position by centering the view and removing any zooming or panning you’ve done. This is a handy and frequently used shortcut;
Copy price
Copies the current price (in this case, 1.04430) to your clipboard, so you can paste it into another tool, chat, or document. This saves time by eliminating the need to type the price manually;
Paste (Ctrl + V)
Pastes copied content (such as a price, text, or drawing), if you've previously copied something from the platform or another app. TradingView now even supports pasting images copied from the internet or other external applications;
Add alert on EURUSD at 1.04430 (Alt + A)
Creates an alert for the EUR/USD instrument at the price of 1.04430. You’ll receive a notification when the price reaches your selected level. Alerts can come as a sound, email, or push notification.
Trade
Allows you to place an order directly from the chart. You can open long or short positions, set pending orders, or modify existing ones by adjusting stop-loss or take-profit levels.
Add EURUSD to watchlist
Adds the EUR/USD currency pair to your watchlist on the right side of the screen, making it easy to track without having to search for it each time.
Add text note for EURUSD (Alt + N)
Lets you add a text note to the EUR/USD instrument. This is especially useful for saving analysis, setup ideas, or reminders.
Lock vertical cursor line by time
Locks the vertical cursor line to a specific time. It’s used to mark a particular candle or a specific date and time in the past or future when something is expected to happen.
Object tree...
Opens a list of all elements applied to the chart - trendlines, indicators, texts, shapes, etc. - allowing for easy management of each item.
Chart template
Loads a saved chart layout, including color schemes, configured indicators, and other personalized settings.
Remove drawings
Deletes all drawings currently on your chart (shapes, texts, lines, etc.). This is mostly used when you want to clear the chart quickly and start a fresh analysis.
Settings
Opens the chart settings, where you can configure visual elements like colors, background, and price lines.
The “Settings” button allows you to personalize your chart exactly the way you like it. Let’s take a closer look at the additional options.
Chart view - settings
The "Symbol" menu in TradingView’s settings lets you customize the visual style of candlesticks and adjust how data is displayed. Here's a detailed explanation of each option:
Candles - This section allows you to change the appearance of Japanese candlesticks on the chart.
- Color bars based on previous close - When enabled, the candle colors will depend on whether the current closing price is higher or lower than the previous candle’s close. If disabled (as shown in the image), the candles are simply colored based on bullish (upward) or bearish (downward) movement;
- Body - Defines the color of the main part of the candle. In the example below, green is used for bullish candles and red for bearish ones. Of course, you can choose any colors you prefer;
- Borders - Lets you select the color of the candle outlines. These borders can match the candle body color or be set to black or white for better contrast, depending on the chart background;
- Wick - This option changes the color of the wicks (the thin lines above and below the body), which represent the high and low prices during that time period.
Data modification
- Precision - Sets how many decimal places will be displayed. The default settings usually work fine, but you can adjust this for more or less accuracy;
- Timezone - Sets the time zone for your chart..

The next button is extremely important and will save you valuable time every time you use the TradingView platform.
This is the “Template” button, located in the bottom-left corner (see the next image).
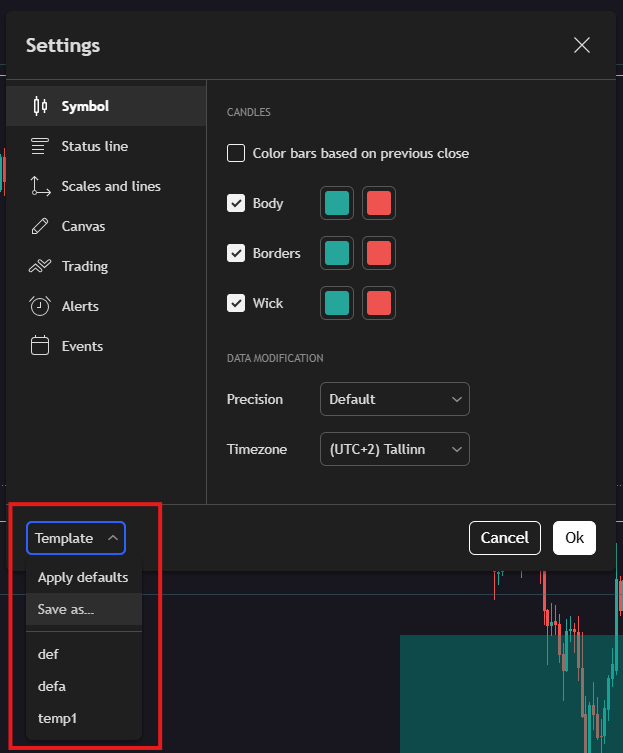
With this feature, you can save your current settings as a template and easily apply them to other charts later. The “Template” button works with all tools—trend lines, shapes, and more.
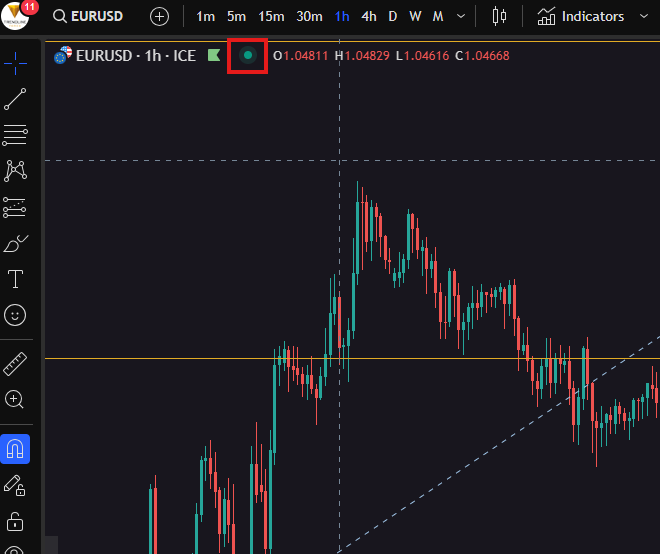
The "Status Line" menu in TradingView’s settings lets you customize the information bar at the top of the chart. This bar displays key data such as the symbol, current price, market status, and other indicators.
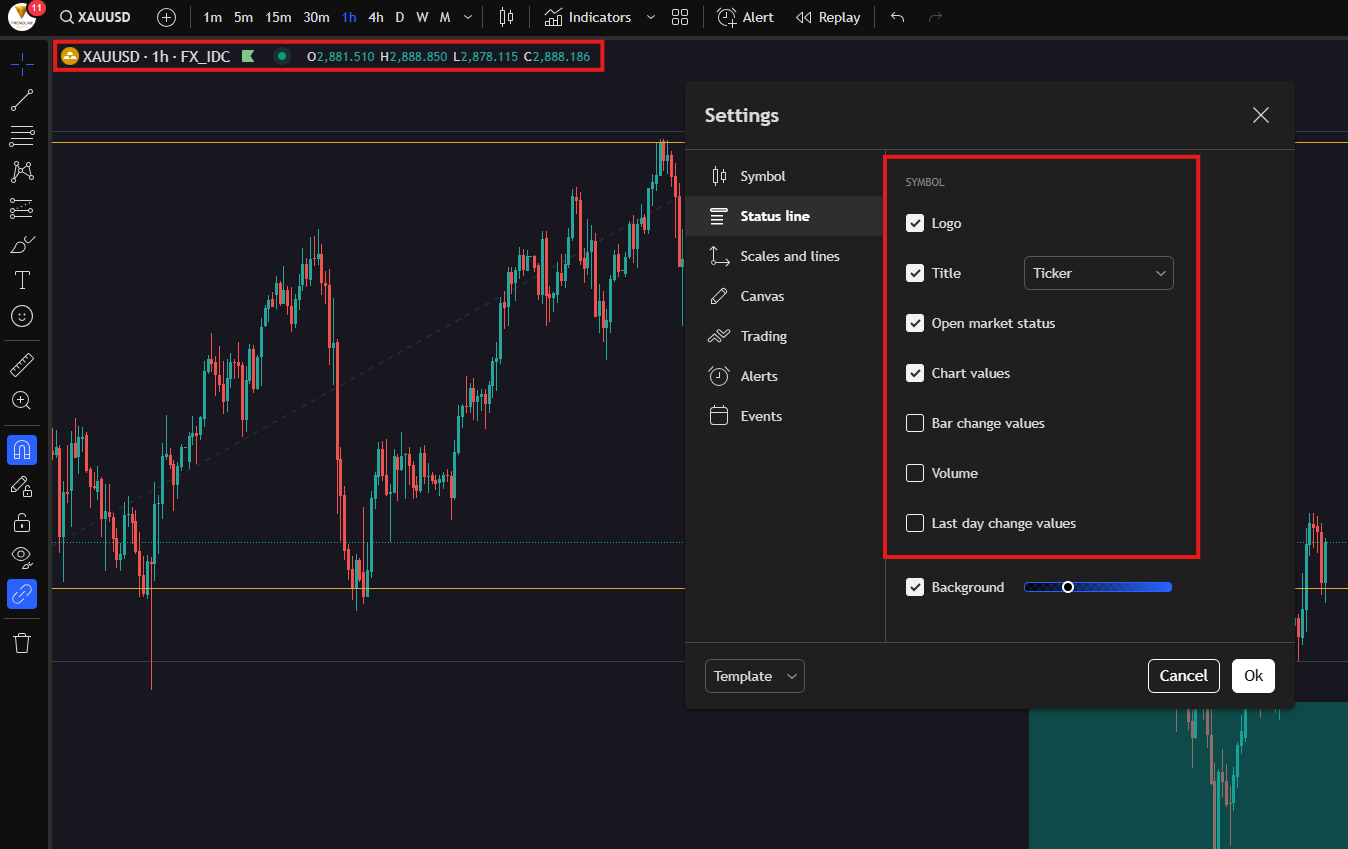
- Logo - When this option is enabled, the logo of the selected instrument will appear at the beginning of the status bar;
- Title - This setting controls how the asset name is displayed in the status bar. By default, it’s set to “Ticker,” which means only the ticker symbol (e.g., XAUUSD) will be shown. You can choose other options, such as the full name of the instrument (e.g., Gold vs US Dollar);
- Open market Status - This setting indicates whether the market is open or closed. If the market is open, you'll see a green dot in the top-left corner of the chart, along with a “Market Open” message when you hover over it;
- Chart Values - This setting controls whether the values for the current bar are shown in the status bar. When enabled, you’ll see the high, low, open, and close prices of the candle. These values appear right next to the green dot;
- Bar Change Values - If enabled, this option displays the price difference between the current and previous candle. The difference can be shown in pips or as a percentage;
- Volume - Adds information about the traded volume for the current period. When turned on, the volume value appears in the status bar. This is especially useful when trading stocks, cryptocurrencies, and other instruments with measurable volume.
- Last Day Change Values - When activated, this shows the difference between the previous day’s closing price and the current price.
- Background - Includes a slider that lets you adjust the background color of the status bar. This is purely a visual customization option that allows you to tailor the interface to your preferences.
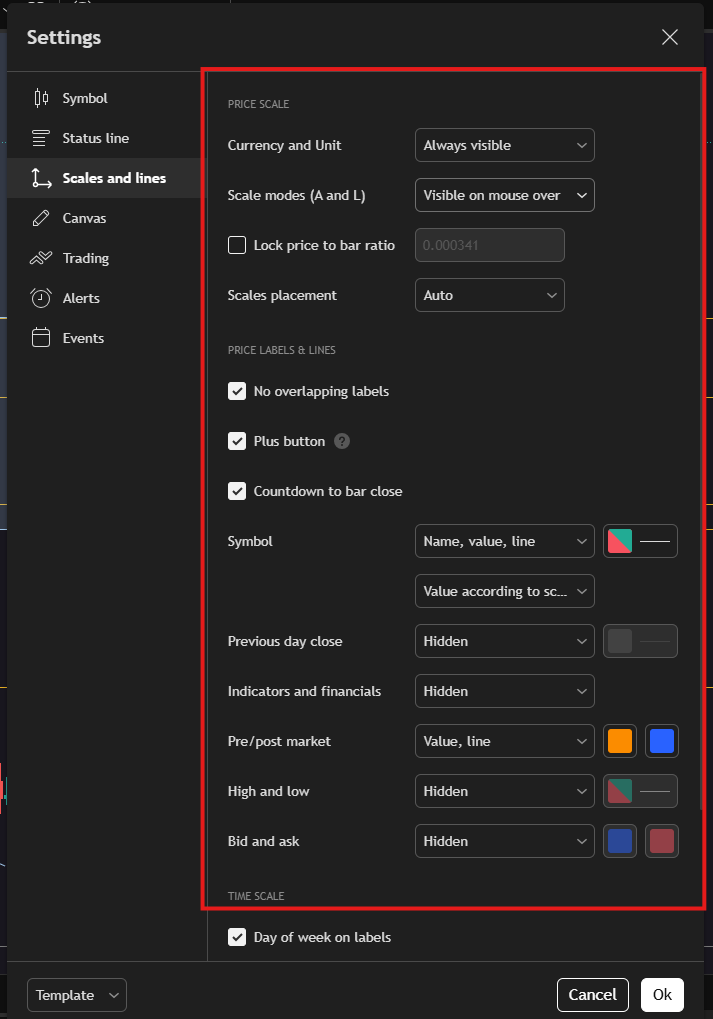
Now, let’s move on to the next settings menu – “Scales and Lines.” This section deals with price scaling, labels, and the lines displayed on your chart.
Here's every option explained in detail:
Price Scale:
- Currency and Unit - Controls whether the currency symbol and units are shown. When set to “Always visible,” the currency will always appear next to the price (e.g., USD for XAUUSD);
- Scale models (A and L) - Determines when the Auto and Logarithmic scale options are shown. “Visible on mouse over” means you’ll only see them when you hover over the scale;
- Lock price to bar ratio - Allows you to lock a fixed ratio between price and time on the chart. If this is turned off, you can freely zoom in and out of the chart;
- Scales placement - Lets you choose where the price scale appears (right, left, or both sides). “Auto” allows TradingView to automatically decide the best placement.
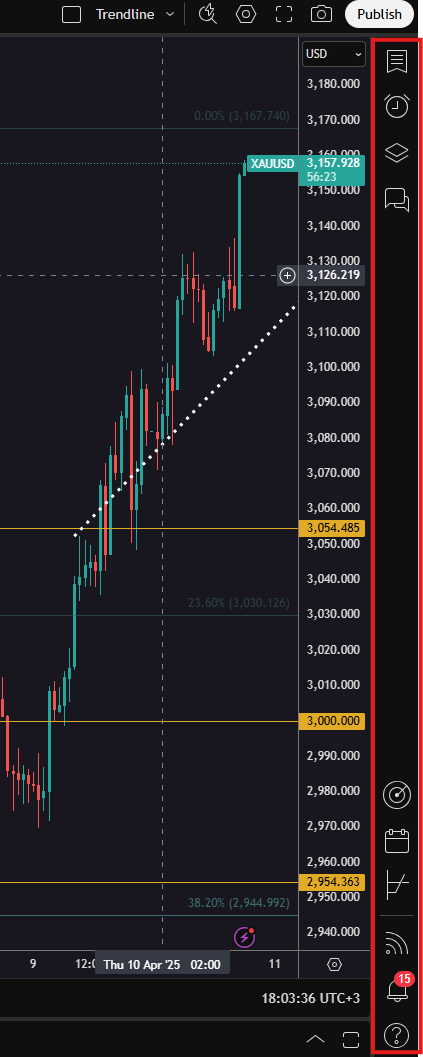
Price Labels & Lines:
- No overlapping labels - When enabled, TradingView will automatically adjust price labels to avoid overlap;
- Plus button - Adds a small “+” button next to the price scale, allowing for quick trade entries;
- Countdown to bar close - Displays a countdown timer on the right side of the chart, showing how much time is left before the current candle closes;
- Symbol - Controls what information is shown on the price scale for the active instrument. “Name, value, line” means you’ll see the asset name, its current value, and a reference line;
- Previous day close - Adds a horizontal line showing the previous day’s closing price. It’s hidden by default but can be enabled for additional reference;
- Indicators and financials - Toggles the display of indicator and financial data labels on the scale;
- Pre/ Post market - Shows prices from pre-market and post-market trading sessions for stocks and futures. Includes both a line and value for better visibility;
- High and low - Displays lines for the day’s highest and lowest prices when enabled;
- Bid and ask - Adds lines representing the current bid and ask prices.
If you scroll further down, you'll find additional settings to change the date and time format.
Up next is the “Canvas” section in the settings menu. These options control the visual appearance of your chart—from background color to the scale of interface elements.
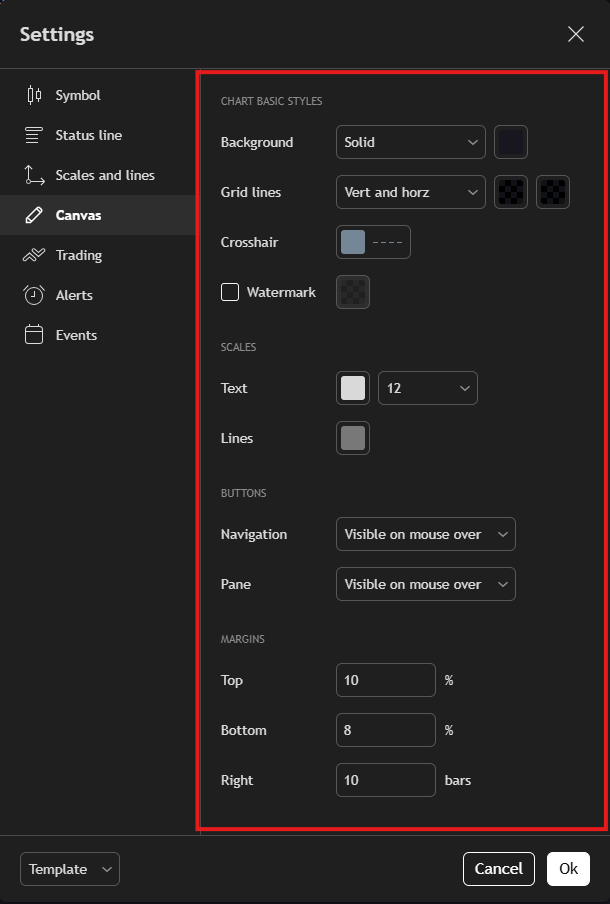
Chart Basic Stiles:
- Background - Lets you change the type and color of the chart background. “Solid” means a single-color background, while “Gradient” gives a blended color effect;
- Grid lines - Controls the vertical and horizontal grid lines on the chart. You can customize their color or disable them entirely;
- Crosshair - Defines how the crosshair (cursor tracker) looks. You can adjust the color, thickness, and style of the lines that follow your mouse;
- Watermark - When enabled, displays the asset name and time frame in the center of the chart as a subtle background element.
Scales:
- Text - Adjusts the font size of the numbers on the price and time scales;
- Lines - Allows you to change the color of the lines on the scales (both price and time);
Buttons:
- Navigation - Controls whether the left/right navigation buttons are visible. “Visible on mouse over” means the buttons only appear when you move your mouse over the chart.
- Pane - Manages the visibility of the side panel that contains additional tools like indicators, drawing tools, and more. You can choose whether it’s always visible or only on mouse movement;
Margins:
- Top - Adds extra space above the highest price on the chart;
- Bottom - Adds extra space below the lowest price;
- Right - Adds spacing to the right of the last candle, creating room between the most recent price and the edge of the chart.
Next, let’s move on to the “Trading” settings menu, where you can control how your trades and positions are displayed in TradingView.
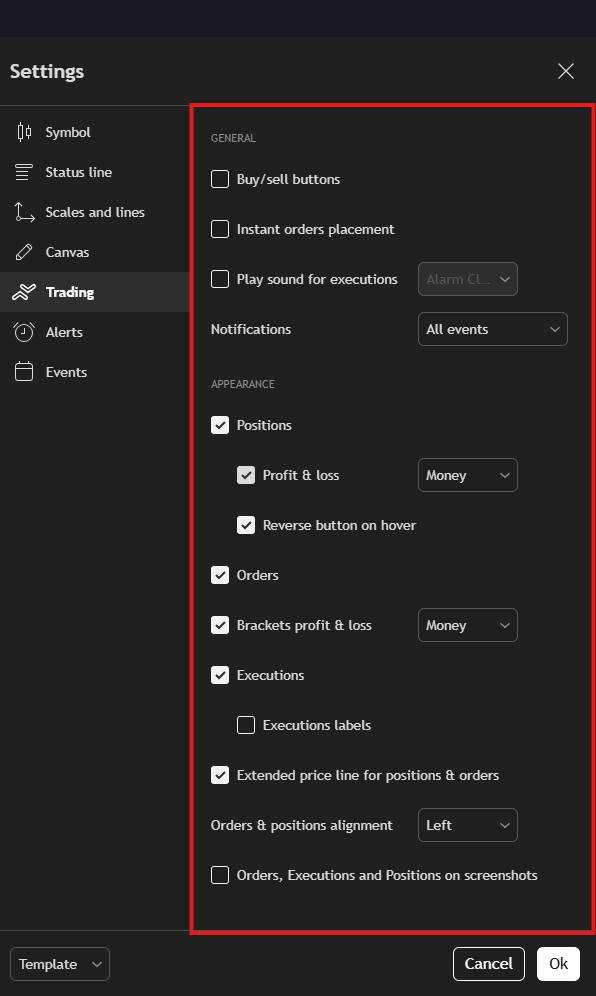
- Buy/sell buttons - When enabled, quick buy and sell buttons appear directly on the chart for fast execution;
- Instant orders placement - Allows you to place orders without an additional confirmation pop-up;
- Play sound for executions - Plays an audio notification when an order is executed;
- Notifications - Manages the types of alerts you receive for trading actions (e.g., order fills, cancellations, etc.).
Appearance:
- Positions - When enabled, your open positions will be shown visually on the chart;
- Profit & loss - Sets how your PnL is displayed. If set to “Money,” it shows real currency values instead of percentages or pips;
- Reverse button on hover - Allows you to quickly reverse a position by hovering over it and clicking the reverse button;
- Orders - Shows all your open orders directly on the chart;
- Brackets profit & loss - Displays the potential profit or loss for bracket orders (stop loss and take profit);
- Executions - Shows executed orders directly on the chart;
- Executions labels - If enabled, adds detailed labels to your executions (including price, volume, etc.);
- Extended price line for positions & orders - Adds horizontal lines that extend across the chart at the levels of your active positions and orders for easier tracking;
- Orders & positions alignment - Controls the alignment of the order and position info in relation to the price scale;
- Orders, Executions and Positions on screenshots - When enabled, includes all trading elements in your chart screenshots.
Next up is the “Alerts” menu, where you can customize how you receive and view trade alerts within the platform.
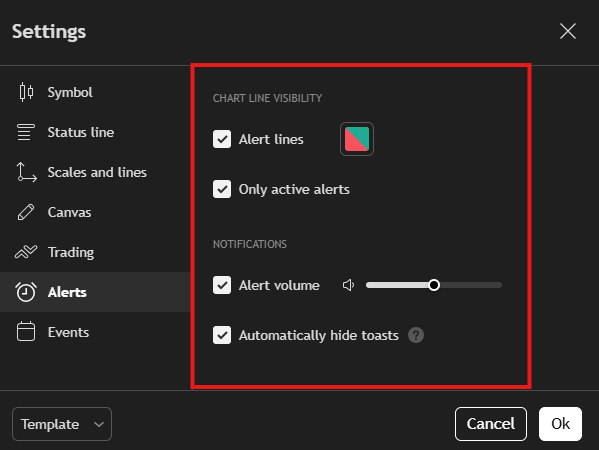
Chart Line Visibility:
- Alert lines - When enabled, this will show your alert levels directly on the chart. You can also customize the color of these lines for better visibility;
- Only active alerts - Displays only the currently active alerts on the chart, hiding any expired or inactive ones.
Notifications:
- Alert volume - Adjust the sound volume of alerts using a slider, so you can control how loud the notification sound is when an alert is triggered;
- Automatically hide toasts - When enabled, pop-up alert notifications will disappear automatically after a few seconds instead of staying on the screen.
The final menu in the settings window is “Events”. From here, you can choose which events and news to display on the chart (such as earnings, dividends, economic data releases, etc.), helping you stay informed while trading.
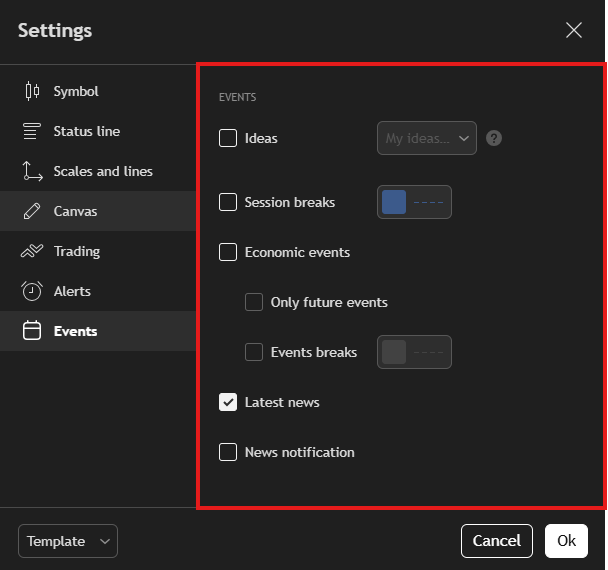
Events:
- Ideas - Displays trading ideas that can be related to market analysis. You can choose to show only your own ideas or also see those shared by other traders;
- Session breaks - When enabled, vertical lines will appear on the chart to separate different trading sessions. You can also customize the color of these lines;
- Economic events - Shows key economic events that might impact the market. You can choose to display only upcoming events or include past ones as well;
- Events breaks - Adds chart lines to mark the timing of major economic events. As with other elements, you can adjust the color to your liking;
- Latest news - When enabled, the most recent financial and economic news will appear on your chart in real time;
- News notification - Allows you to receive alerts for breaking news that could affect the market.
Your chart should now be fully customized to your preferences. Next, we’ll explore how to add indicators and use technical analysis tools effectively.
Adding indicators
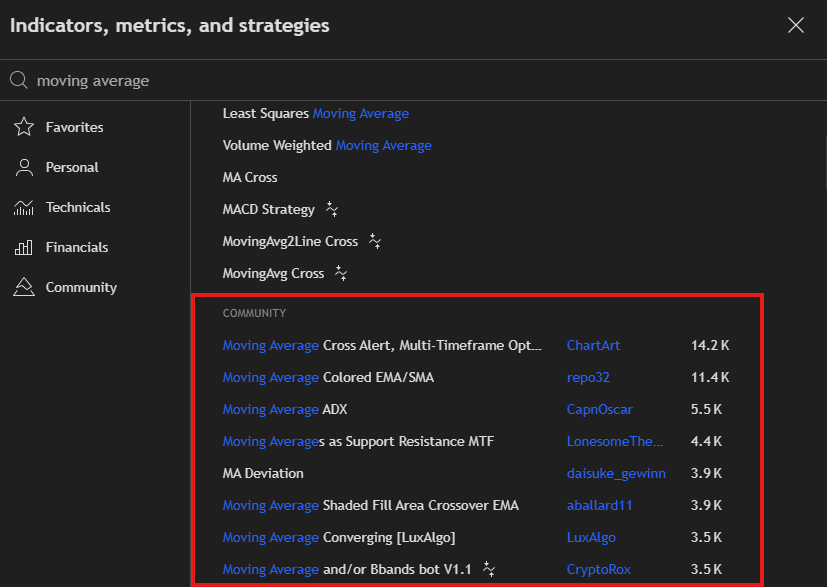
The "Indicators" button in TradingView, located at the top of the screen, opens the menu for indicators, metrics, and strategies. This menu lets you add technical indicators to your chart, helping you analyze market movements more effectively.
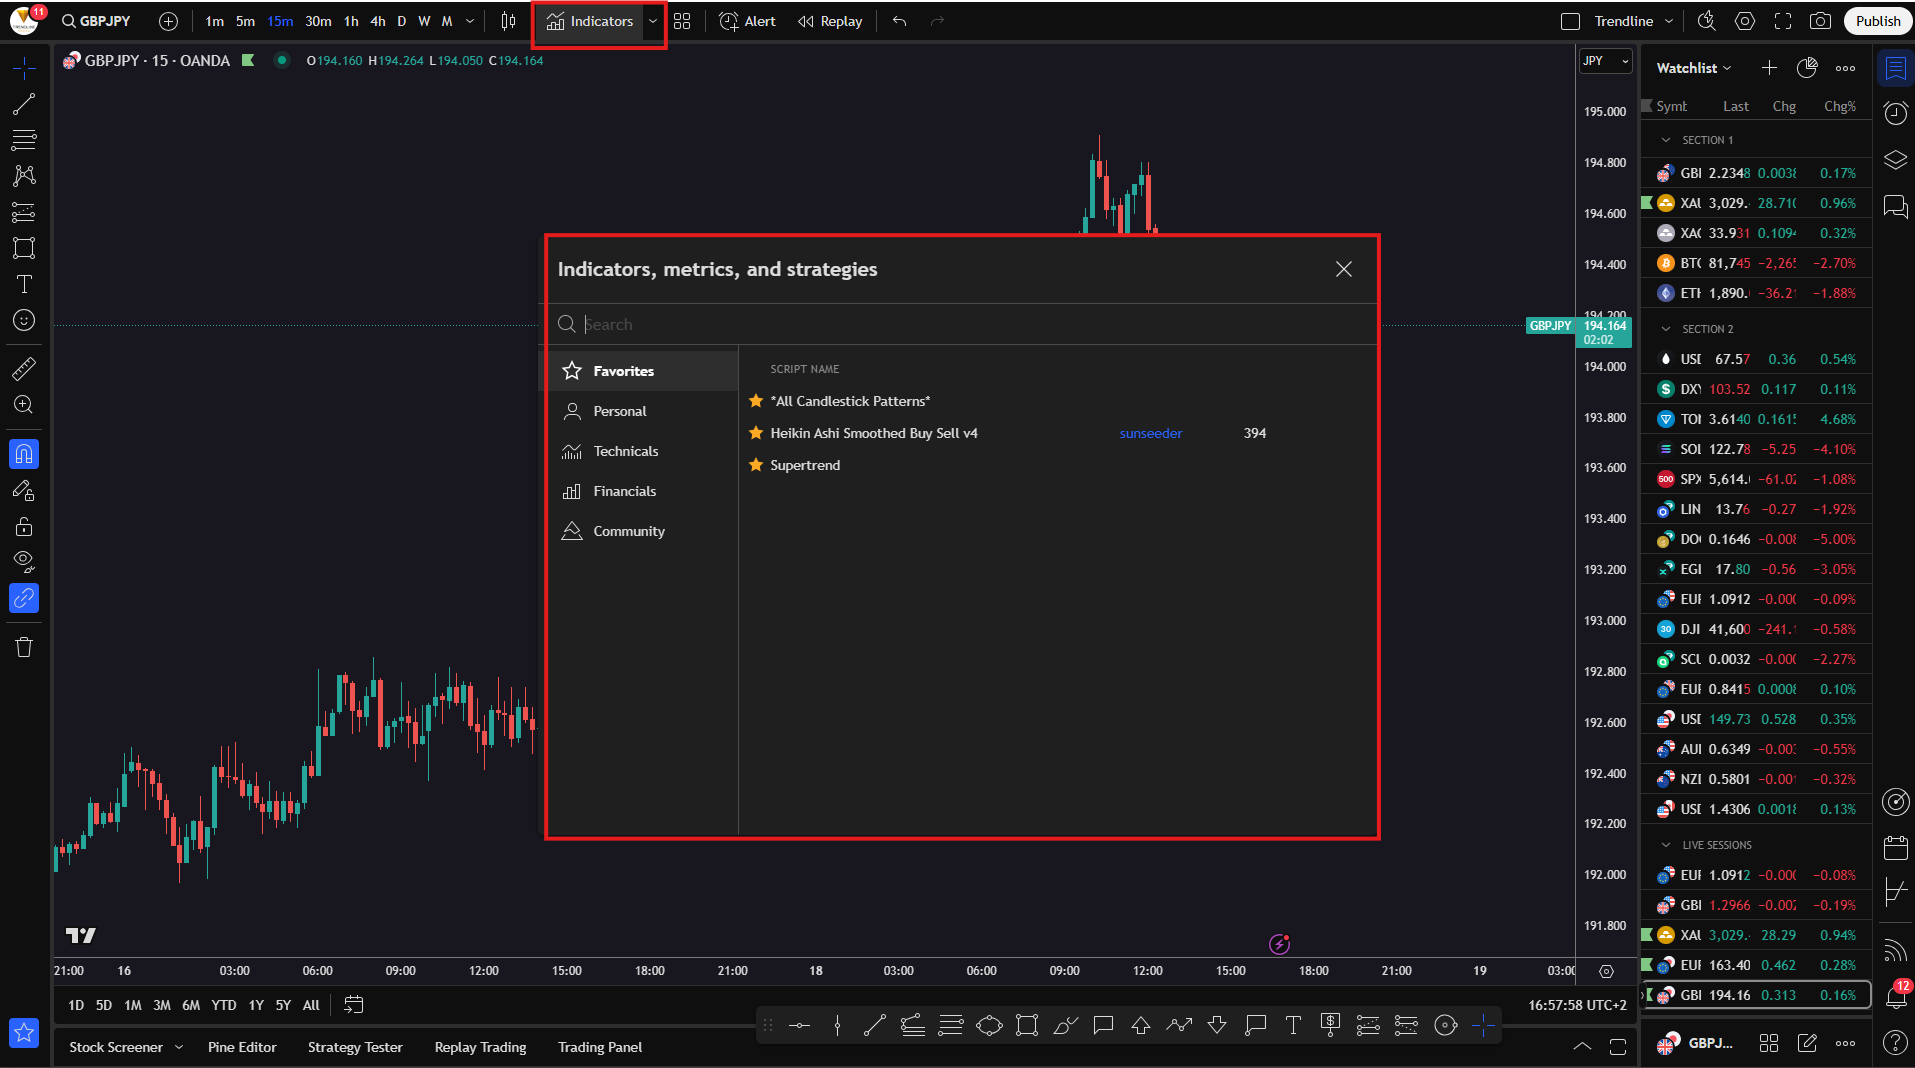
After clicking the “Indicators” button, you'll see a window with several main categories:
- Favorites - A list of indicators you’ve starred for quick access;
- Personal - Indicators you've created or customized yourself;
- Technicals - Includes classic technical indicators like Moving Averages, RSI, MACD, Bollinger Bands, and more;
- Financials - Displays fundamental data such as a company’s revenue and earnings;
- Community - Indicators created by other TradingView users, which you can use and add to your chart.
To add an indicator:
- Click the “Indicators” button in the top menu;
- Use the search bar in the window to find the indicator you want;
The indicators in the Community section are not provided by the platform itself but are custom-built by other traders. You’ll recognize them by the extra details shown next to their name, such as the creator’s username and the number of downloads.
- Click on the name of the indicator – it will be automatically added to your chart;
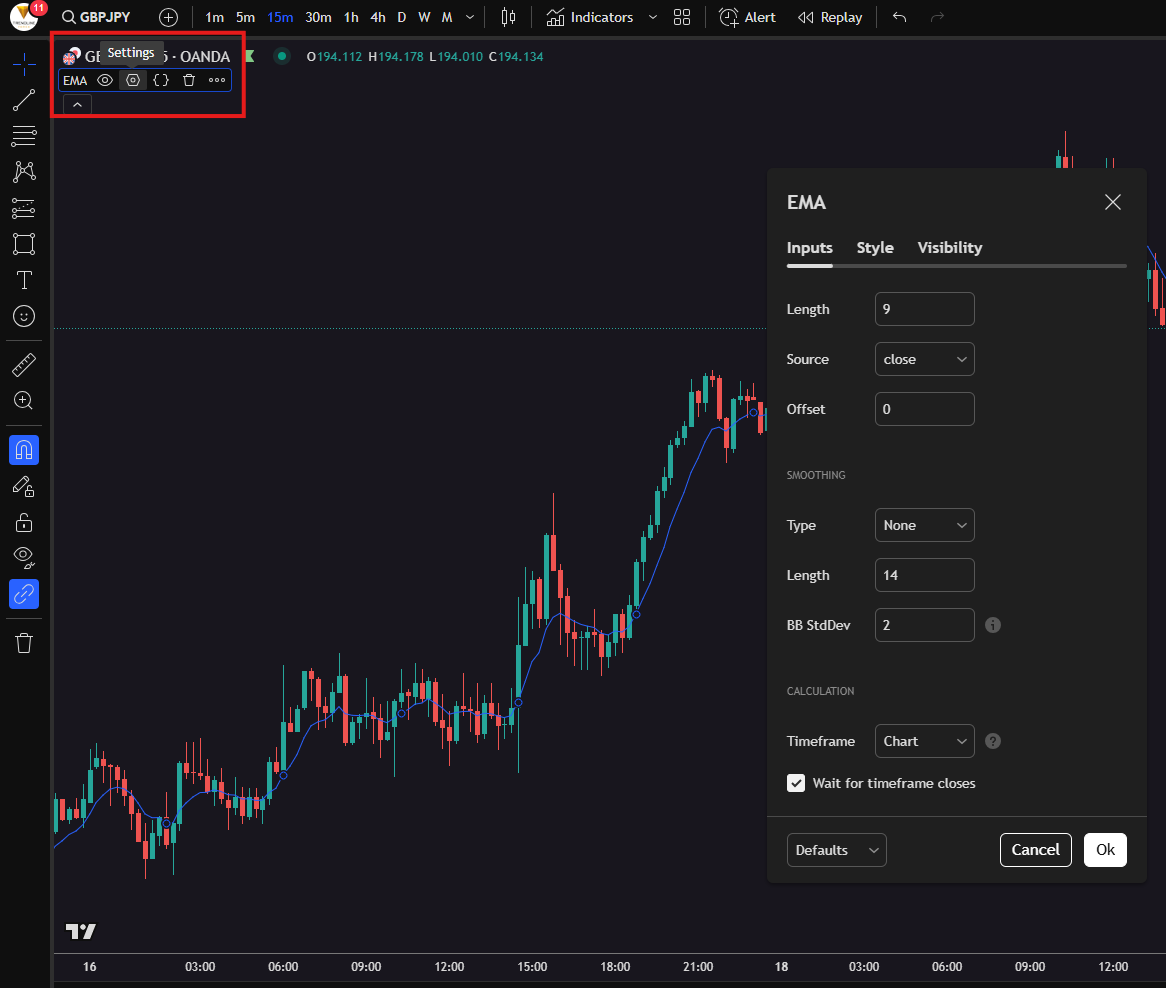
- Adjust the indicator’s settings or appearance if needed.
You can do this by clicking the gear icon next to the name of the indicator you've already added to the chart.
How to remove an indicator from the chart?
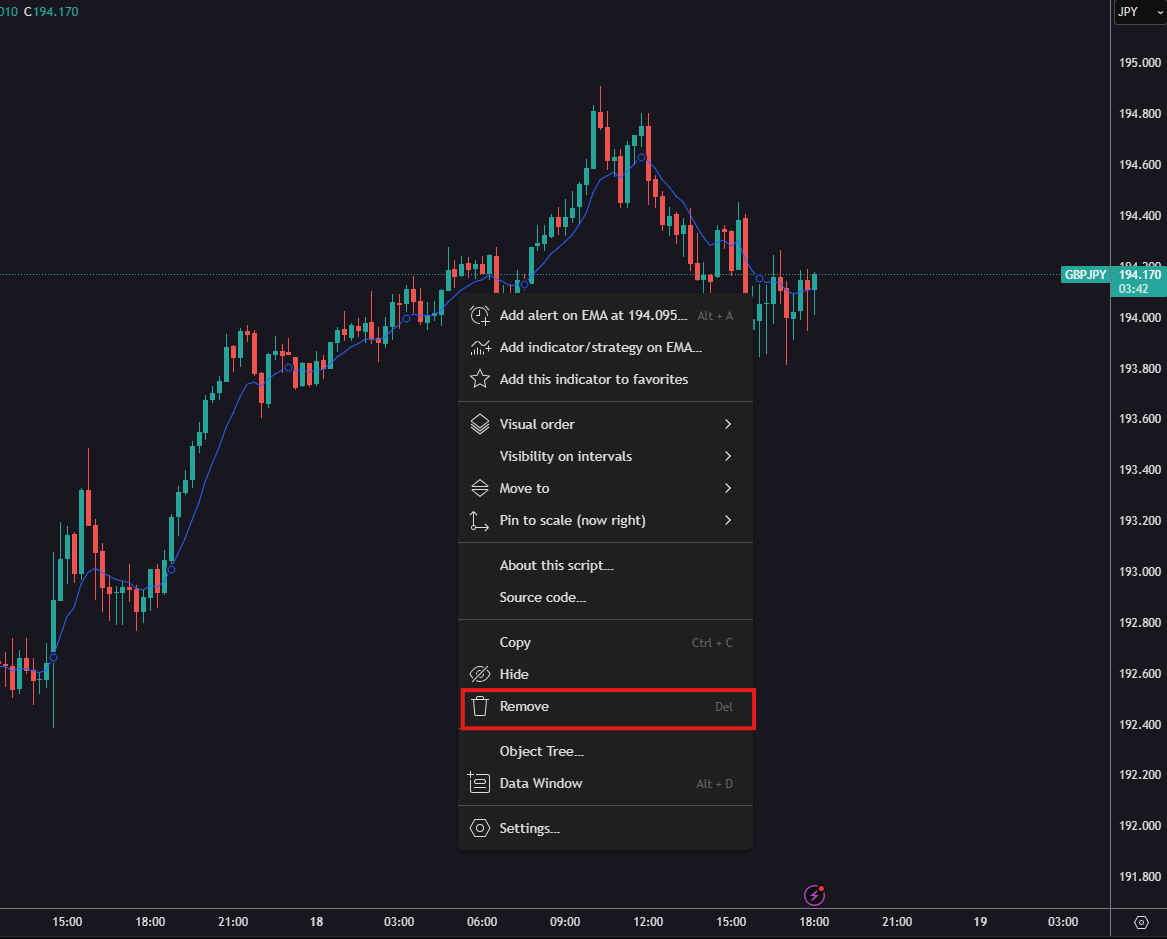
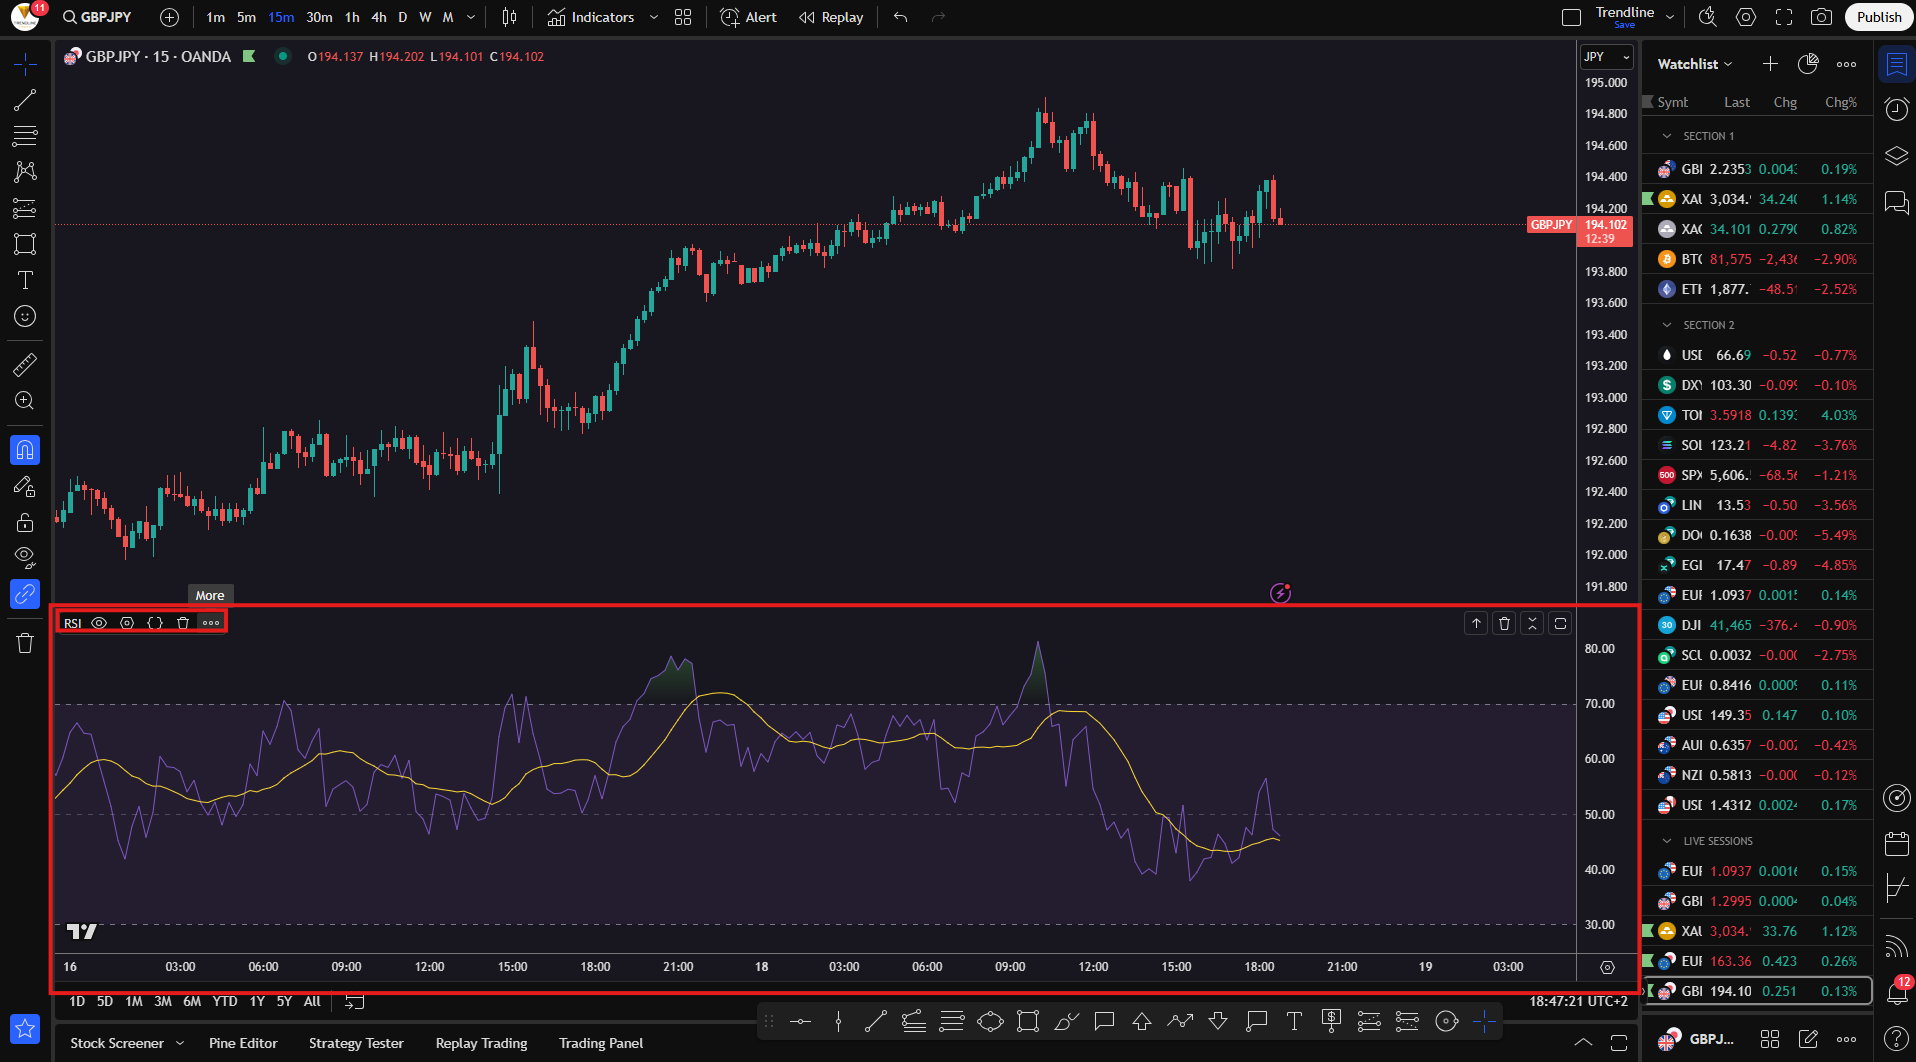
If you decide to remove an indicator - whether to add a different one or because you no longer need it - you can do so in a few different ways:
Click on the indicator directly on the chart and select “Remove”, or simply press the “Delete” key on your keyboard;
You can also use the three-dot button for more options, as shown in the image below. From there, you’ll be able to remove the indicator or access additional settings.
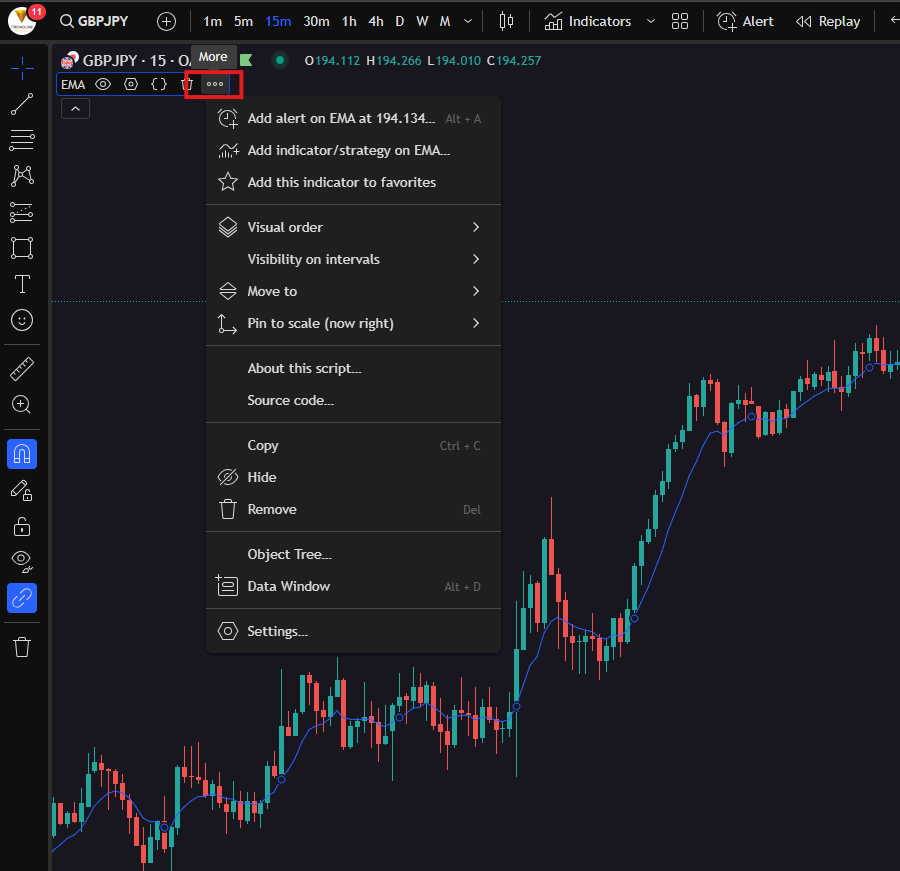
When the additional options menu opens, you’ll see several features available, such as:
- Adding an alert to the indicator;
- Adding the indicator to your favorites;
- Choosing which timeframes it should appear on and whether it’s displayed above or below the price;
- Viewing the indicator’s code;
- Hiding the indicator from the chart, and more.
Some indicators - like MACD, RSI, and similar - will appear in a separate pane below the price chart. There, you’ll also find options to customize or remove them directly.
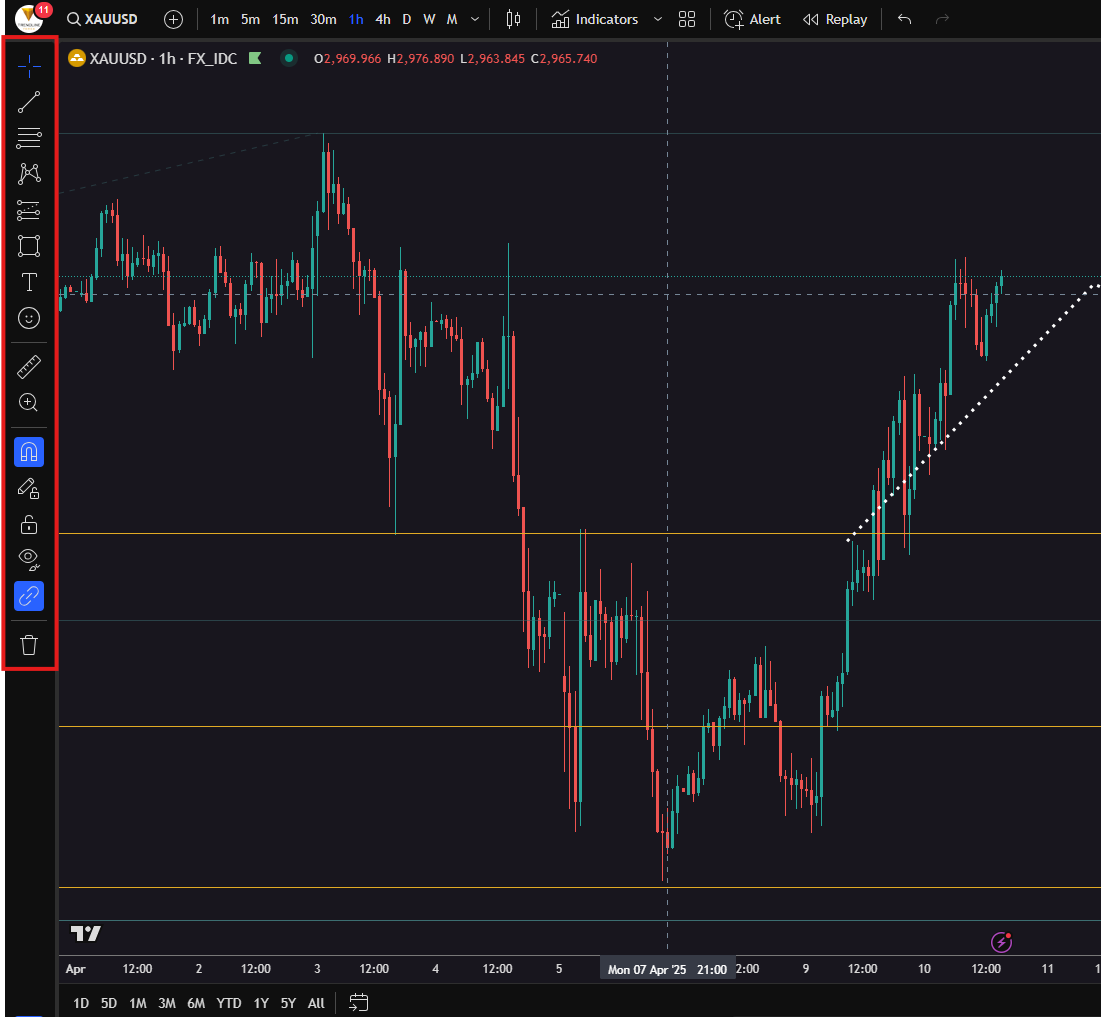
Technical analysis tools
Let’s go over all the tools in the vertical toolbar on the left. This is the drawing tools bar, which you'll use to perform technical analysis directly on the chart.
Cursor
Allows you to choose the type of cursor you want to use:
- Cross – the most commonly used for precise work. As you move your mouse, the cross displays details like the current price level, date, and time;
- Dot, Arrow, Eraser – for visual preference or for deleting objects.
Trend Line Tools
Here you'll find:
- Trend Line – the core tool for drawing upward/downward trends;
- Info Line, Horizontal Line, Vertical Line – for marking specific price levels or time points;
- Extended Line, Ray, Arrow, Parallel Channel – various options for analyzing market structure.
Most commonly used to highlight trends and key support/resistance levels..
Fibonacci Tools
- These allow you to draw: Fibonacci Retracement, Fibonacci Expansion, and more;
- Used for identifying potential correction levels, targets, and price reactions.
Brush & Shapes
- Brush – for freehand drawing;
- Rectangle, Ellipse, Triangle – basic geometric shapes;
- Path, Curve – to draw curves on path.
Useful for visually highlighting zones like demand/supply areas.
Annotation Tools
- Text, Note, Callout, Balloon – tools for adding comments, labels, and arrows;
- Price Note – displays a note with the exact price level;
- Arrow Marker – to indicate direction.
Perfect for documenting your analysis or sharing it with others..
Pattern Tools
- Head and Shoulders, Triangle Pattern, ABCD, Harmonic Patterns, etc.;
- Allows you to draw classic patterns from technical analysis.
Ideal for traders who rely on chart patterns in their trading strategy.
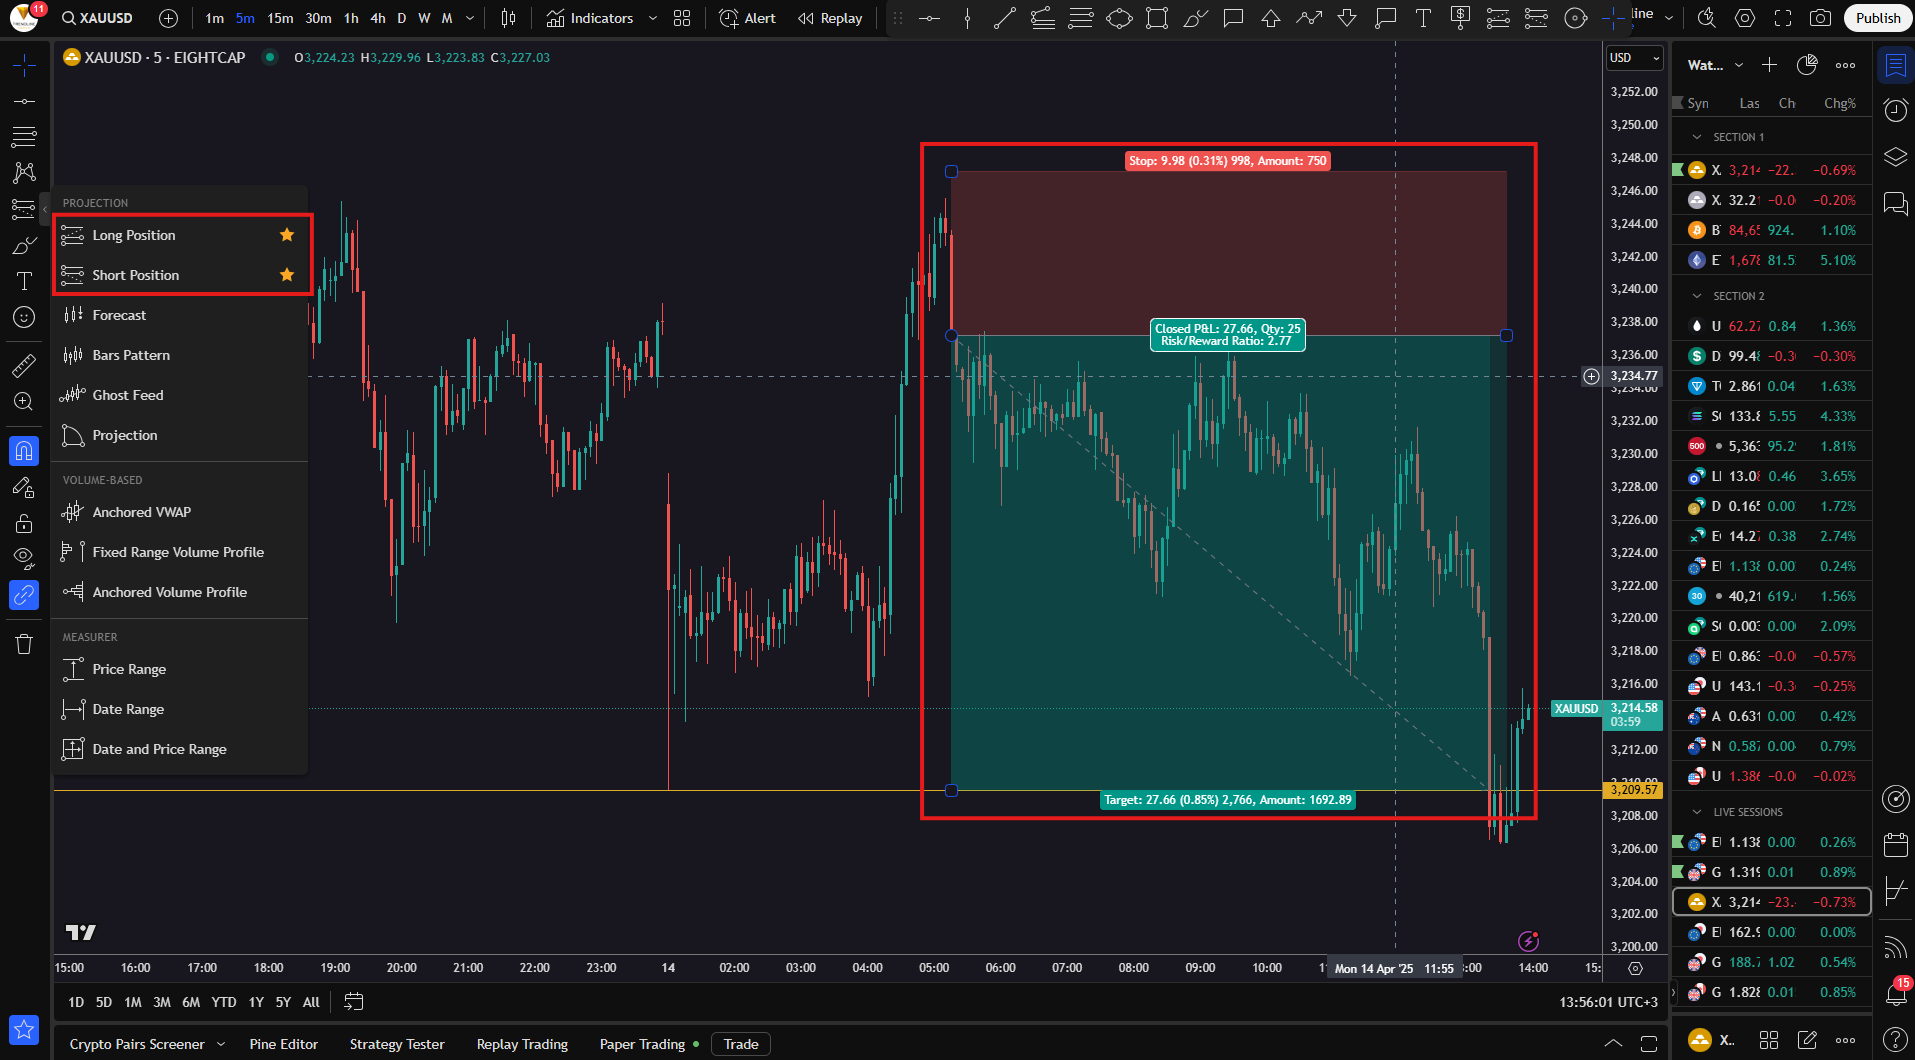
Prediction & Measurement Tools
- Long/Short Position – simulate a trade with entry, stop loss, and target;
- Price Range, Date Range, Measure – measure price moves, time duration, and % changes.
Crucial for evaluating risk-to-reward scenarios.
Icons
- A variety of symbols - arrows, check marks, flags, and more;
- Used for adding quick visual notes to the chart.
Measure
- Quickly measures the distance (price movement) between two points on the chart;
- Displays data like % change, number of candles, time duration, etc.
Shortcut: Hold Shift, click with the left mouse button, and drag across the area you want to measure.
Zoom In/Out
- Manually zoom in or out of the chart view..
Magnet Mode
- When enabled, drawing tools will automatically snap to the open, high, low, or close of candlesticks.
Great for precise charting.
Stay in Drawing Mode
- When turned on, you can continue drawing multiple lines without needing to reselect the tool each time. To return to regular mouse mode (for moving the chart), you'll need to turn this off.
Lock All Drawing Tools
- Prevents accidental movement or editing of drawings on the chart.
Hide/Show Drawing Tools
- Temporarily hides everything you've drawn on the chart.
Remove Drawing Tools
- Deletes all drawing objects from the chart with a single click.
You can fully customize any drawing tool - change the color, line thickness, add text, choose which timeframes it’s visible on, and more. Just double-click on the tool after placing it on the chart.
Top toolbar with additional features
Next, we’ll move on to the top toolbar, where many of the platform’s key features are located.
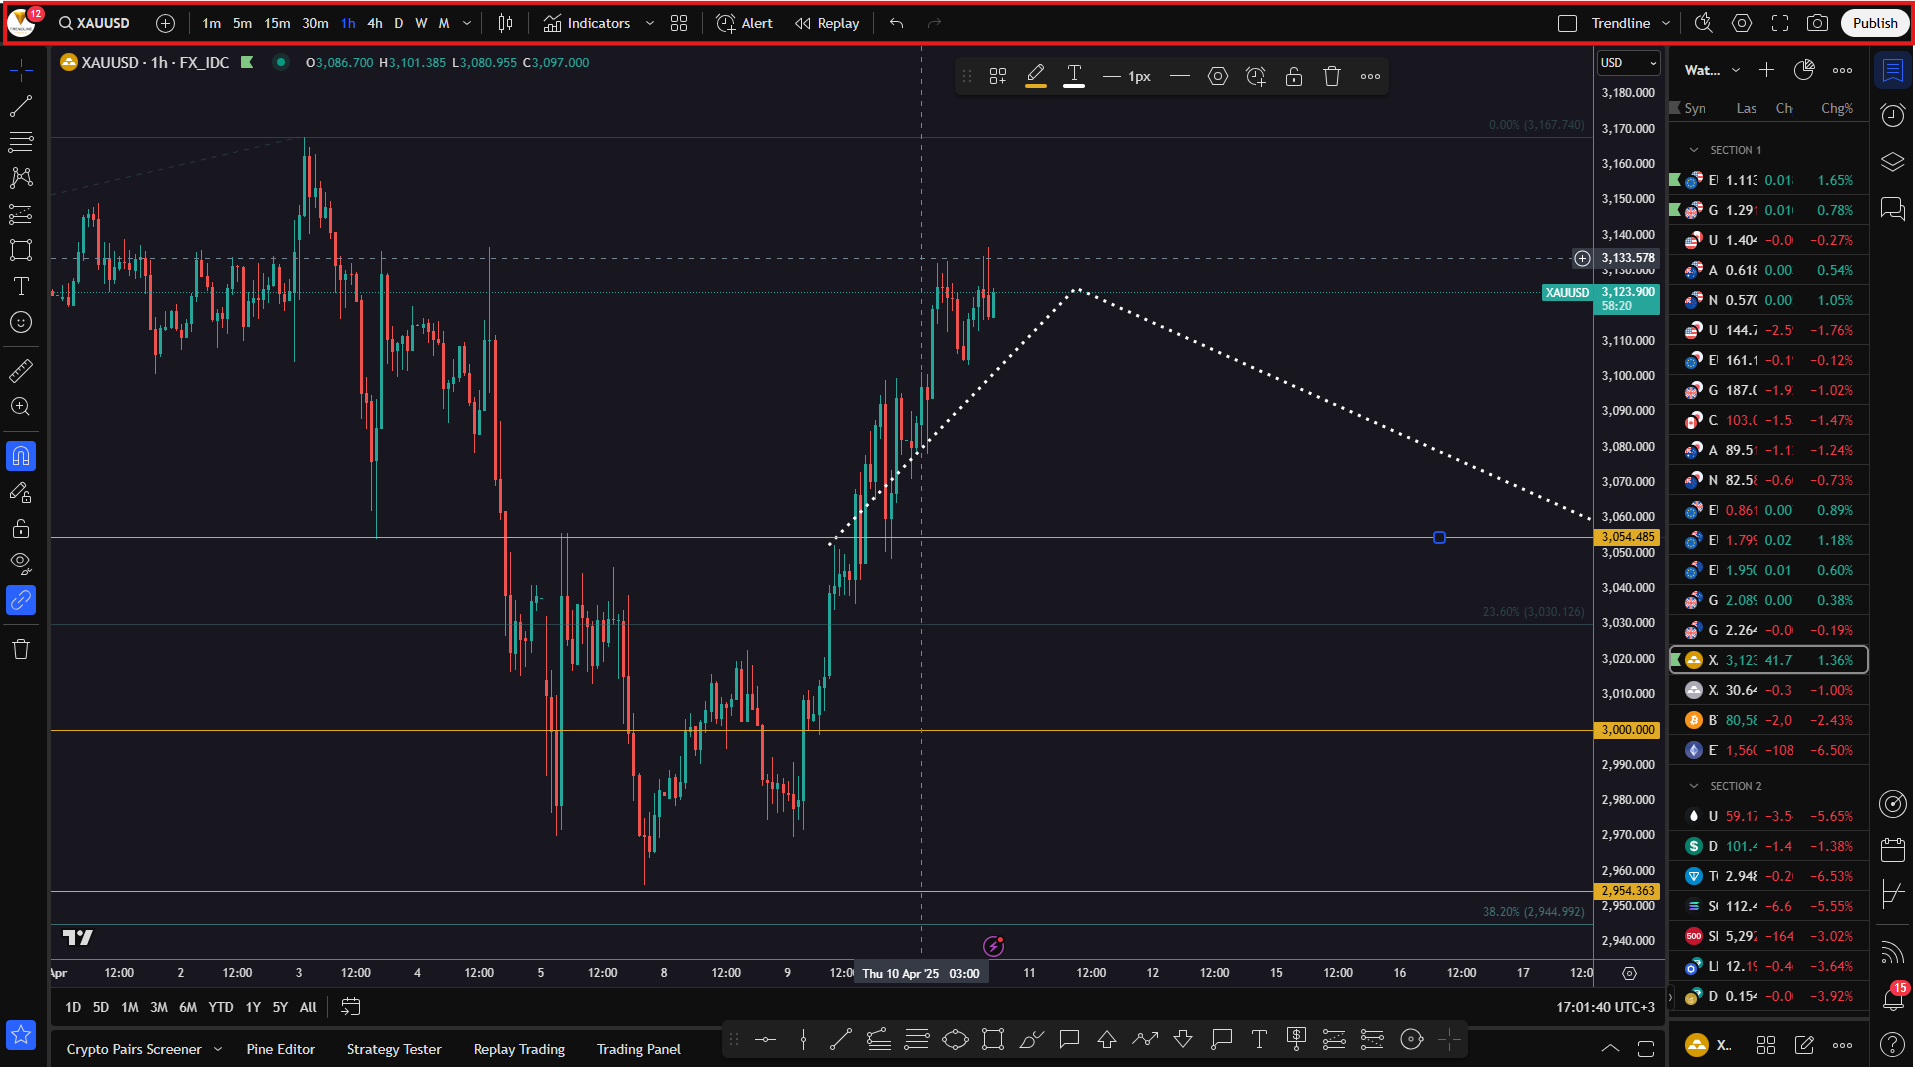
Chart Symbol (e.g. XAUUSD)
This allows you to search for and switch between symbols – for example, EURUSD, BTCUSD, AAPL, and more.
When you click on it, you can choose from various categories like:
- Currency pairs;
- Stocks;
- Cryptocurrencies;
- Indices;
- Futures, and others.
Important note: When you type the symbol of the instrument you want to add, you’ll often see multiple versions of the same symbol appear.
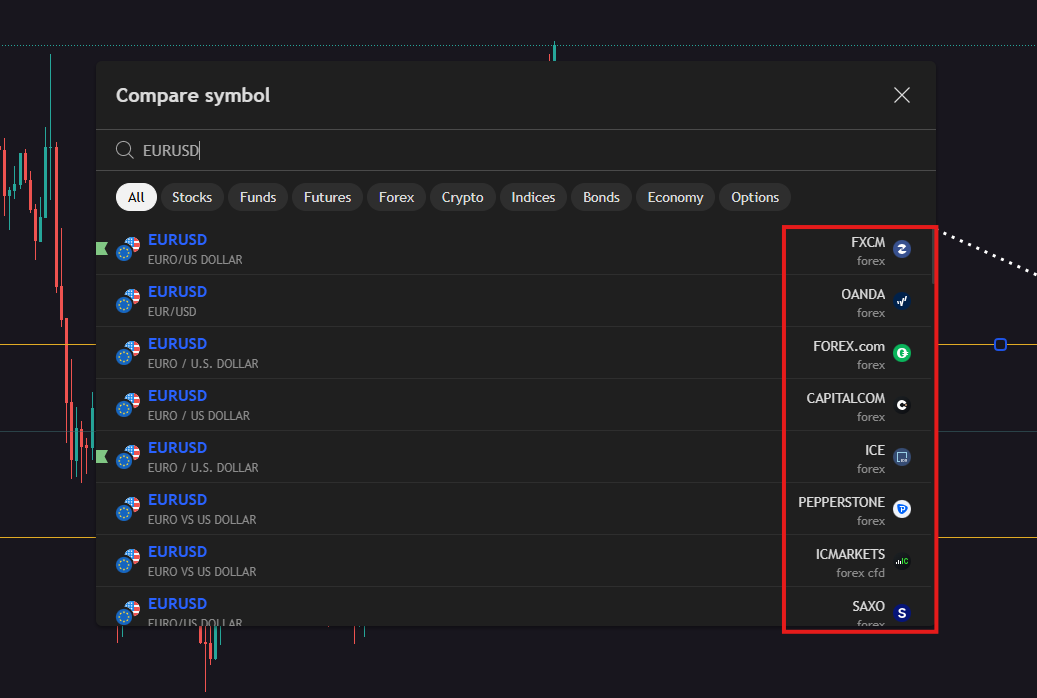
This happens because TradingView integrates with multiple brokers, each offering access to the same instrument's chart. Whenever possible, choose the version of the instrument provided by the broker you have an account with.
If you don’t have a live or demo account yet, you can explore the conditions offered by our partner brokers and open an account through them. We’ll assist you with the account setup and you’ll also receive exclusive benefits for joining through us.
Join Trendline’s community!
At TRENDLINE, we have carefully selected some of the best Forex brokers in the world. Here are 7 reasons why you should trade with them.
Timeframes (1m, 5m, 15m, 30m, 1h, 4h, D, W, M)
This is where you choose the time period you want to view:
- 1m - 1 minute;
- 1h - 1 hour;
- D - daily timeframe, etc.;
You can add your favorite timeframes for quicker access. If you have a paid TradingView subscription, you’ll also have access to additional timeframes that aren’t available in the free version.
Chart type (currently: Candles)
Here, you can change the type of chart you're viewing:
- Candles;
- Line;
- Bars;
- Heikin Ashi;
- Renko, Kagi, and others.
Indicators
We’ll skip this section since we already covered it earlier in the article.
Alert
This feature allows you to set up notifications when certain conditions are met—for example, when the price reaches a specific level. You can get alerts for:
- price hitting a certain level;
- breaking a trendline;
- indicator crossovers and more.
Replay (Simulate past market movements)
This tool lets you go back in time and simulate how the market moved. It’s incredibly useful for testing different trading strategies.
Undo (Revert last action)
Reverses your most recent action (e.g., brings back a deleted line).
Redo (Repeat last undone action)
Restores the last action you undid (e.g., deletes a line again if you had just brought it back).
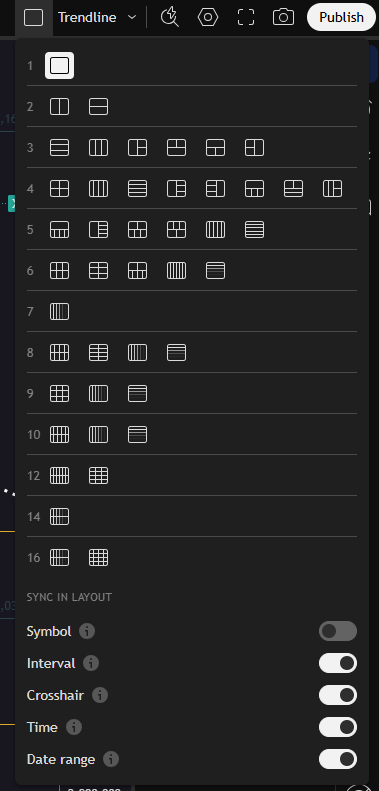
Chart Layout – Multiple Screens at Once
This feature lets you view several charts on your screen at the same time. You can choose a layout that suits your workflow best. Keep in mind that not all layout options are available in the free version of TradingView.
Template for drawings
Here, you can save a chart template with all your current settings, including the tools and drawings you've added.
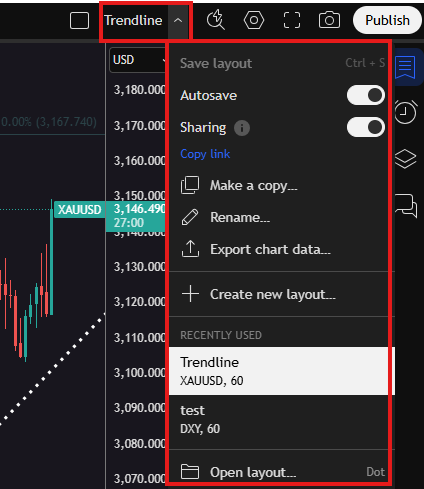
As you can see in the image, our template is called “Trendline.” If you're testing different chart views or even various strategies, you can create separate templates for each of them. This way, you can easily switch between your saved templates and work more efficiently.
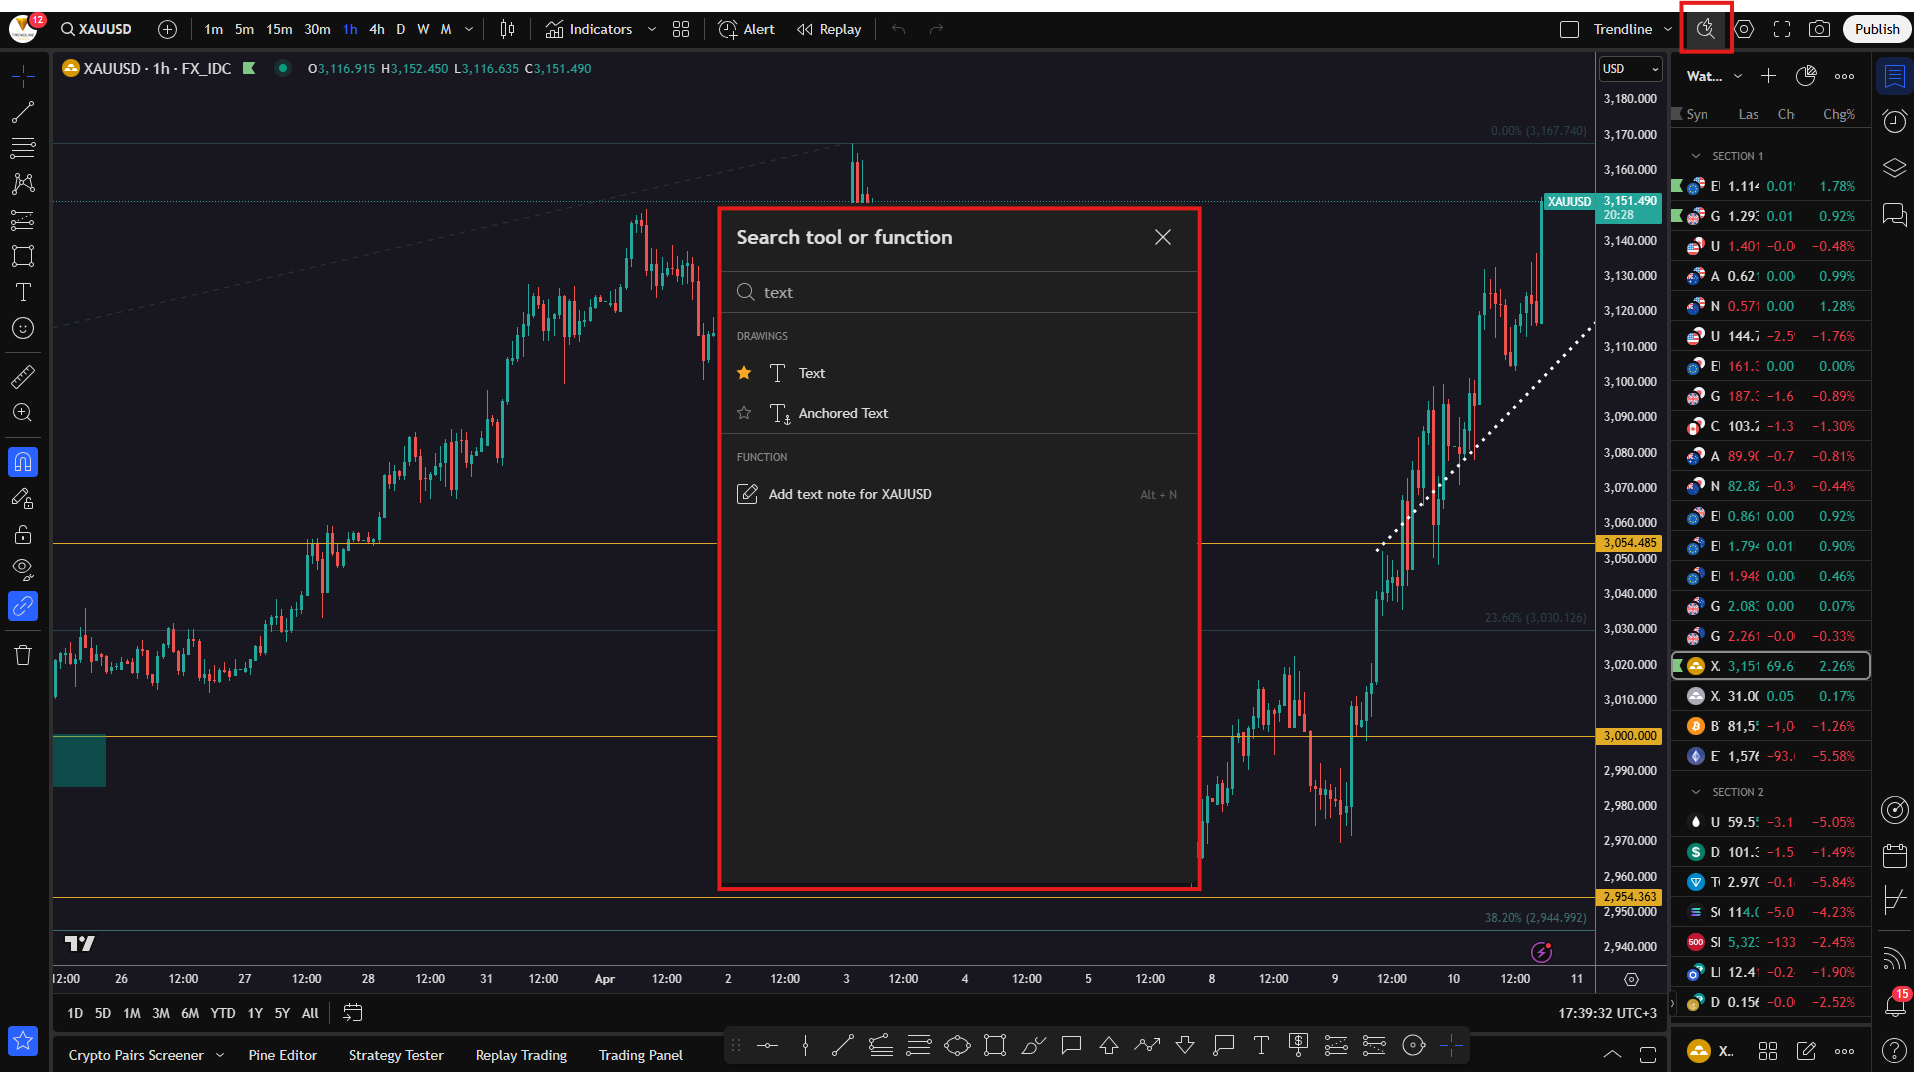
Search Tool (Magnifying glass with lightning icon)
To the right of the "Save Template" button, you'll see an icon of a magnifying glass with a lightning bolt. Clicking this opens a search bar where you can type exactly what you're looking for and quickly access the tool or feature you need.
Camera Icon (Screenshot)
We’ll skip the next two buttons - fullscreen and settings - and move on to the camera-shaped icon. This button allows you to take a screenshot of your chart exactly as it appears on your screen.
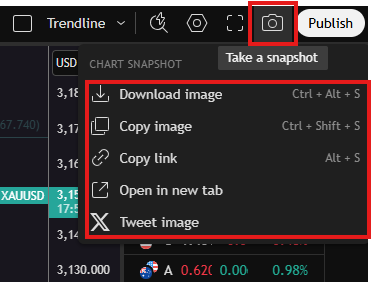
As you can see in the image, this button lets you take a screenshot of your chart. You can copy it, download it, or share it directly to “X” (formerly Twitter). We recommend always downloading a screenshot of your trades and saving it in a folder with your other positions. This way, you can review and analyze your results at the end of each week, month, or year.
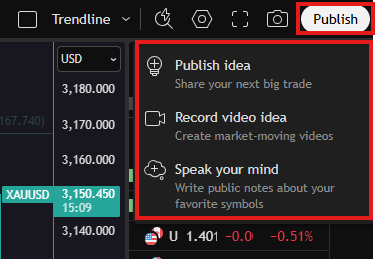
Publish button
This allows you to share your trading idea with the TradingView community, including your chart, commentary, and analysis. It will also create a public post on your profile.
Watchlist
The “Watchlist” menu is an incredibly useful tool for monitoring multiple assets at once. It allows you to quickly switch between different markets, sort and group them, make changes, and analyze them in real time.
Here’s what our watchlist looks like:
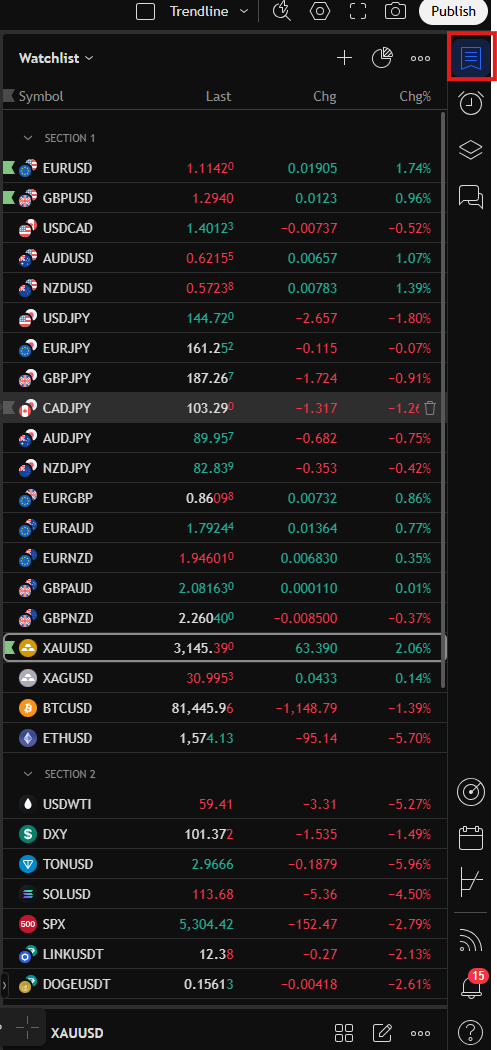
The Watchlist in TradingView is a list of financial instruments (such as stocks, currencies, cryptocurrencies, indices, etc.) that you actively monitor. It gives you the ability to:
- Add new symbols (e.g., EURUSD, BTCUSD, SPX);
- Group instruments into sections;
- View live price data, changes, and percentage movements;
- Delete, sort, and manage the list with ease.
Adding a new instrument (+)
Click the + button, type in the name or ticker symbol of the asset (e.g., “Tesla” or “USDJPY”), select it from the dropdown, and it will be added to your Watchlist.
More options menu (⋯)
From this menu, you can:
- Create new watchlists (e.g., “Forex,” “Crypto,” “Stocks”);
- Import or export a list;
- Save your current changes;
- Delete an entire list.
Switching between lists - "Watchlist" dropdown menu
If you have multiple watchlists, you can easily switch between them using the dropdown menu. For example, you might keep separate lists for cryptocurrencies, stocks, and forex pairs.
What do the columns in the watchlist mean?
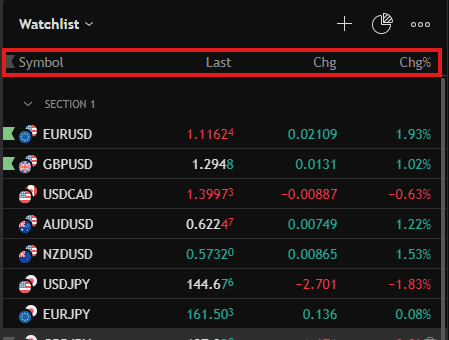
These are:
- Symbol - The name or ticker of the instrument (e.g., EURUSD);
- Last - The last traded price;
- Chg - The price change in absolute terms;
- Chg% - The price change in percentage terms (very useful for comparing different instruments).
Sections - grouping your instruments
Sections help you organize your Watchlist more efficiently. You can create categories such as:
- Forex;
- Crypto;
- Indices;
- Stocks.
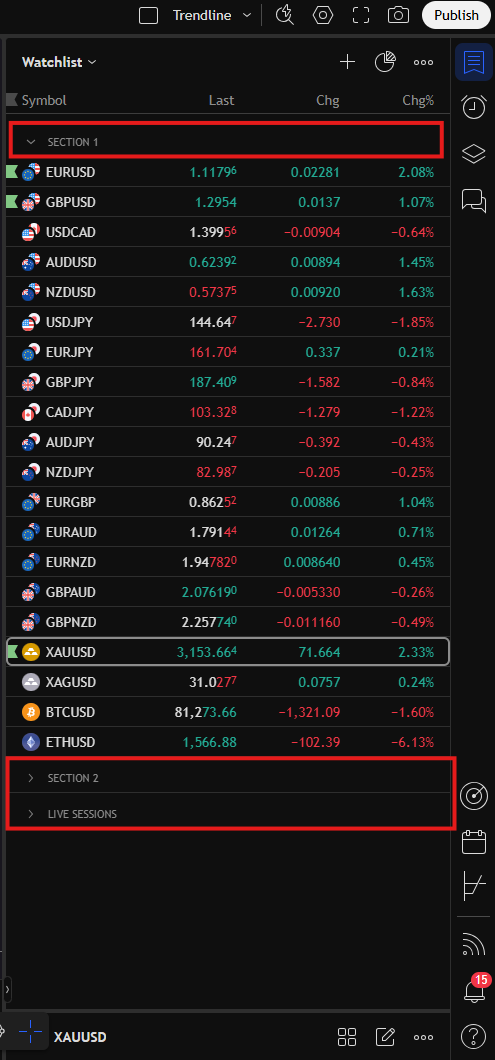
To create a new section, simply right-click anywhere in your Watchlist. Then select “Add section” and enter a name for your new group.
To remove a symbol from a section, hover your mouse over it and click the trash icon that appears on the right side of the row.
Extra features (right-click on a symbol)
- Open the chart in a new window;
- Change the row color;
- Assign a custom label;
- Add a note;
- Set an alert directly from the Watchlist.
More features in the right sidebar
This is your quick-access toolbar for various functions not related to drawing on the chart. It includes tools for: analysis, communication, alerts, notes and portfolio management.
We move straight to the second option after the watchlist - the alarm button.
Alerts
This section displays all active, expired, or newly created alerts. You can:
- Create alerts based on price, indicators, or trendlines;
- Set up notifications via email, sound, pop-up, and more;
- Manage all your alerts in one place.
Data window
Shows detailed information for a specific candle, including open, close, high, low, volume, and indicator values. It's extremely useful for precise technical analysis. This panel appears when you hover over a specific candle on the chart.
You’ll also find a list of all your drawings (trendlines, ellipses, text, etc.) in this section.
Chats
From here, you can access public and private chats. In public chats, you’ll find discussions on various topics where other traders share their opinions.
Screeners
TradingView screeners help you quickly find assets (stocks, forex, crypto, ETFs) that meet specific criteria like price, market cap, volume, yield, and more. You can customize filters to match your strategy – for example, looking for fast-growing stocks or high-volume currency pairs. They save time and help you discover trading opportunities with just a few clicks.
Calendar
Shows the most important economic news and events that impact the markets. You can filter by currency, impact level, date, etc. Very useful for fundamental analysis and avoiding high-volatility periods.
Options
The Options menu in TradingView lets you create and analyze options strategies using visual profit/loss graphs.
You can base these on selected strike prices, expiration dates, and position types (e.g., long call, short put). It displays key metrics like max loss, breakeven point, win rate, and delta – so you can assess risk and potential profit. Perfect for testing different scenarios before entering a real options trade.
Notifications
Displays all your notifications – from alerts, followers, and comments to updates. You can personalize which notifications you want to receive and how.
Chat assistant
The final feature in this panel is the question mark button. If you can’t find a certain feature in the platform, type your question in this field and you’ll get guidance on where to locate it.
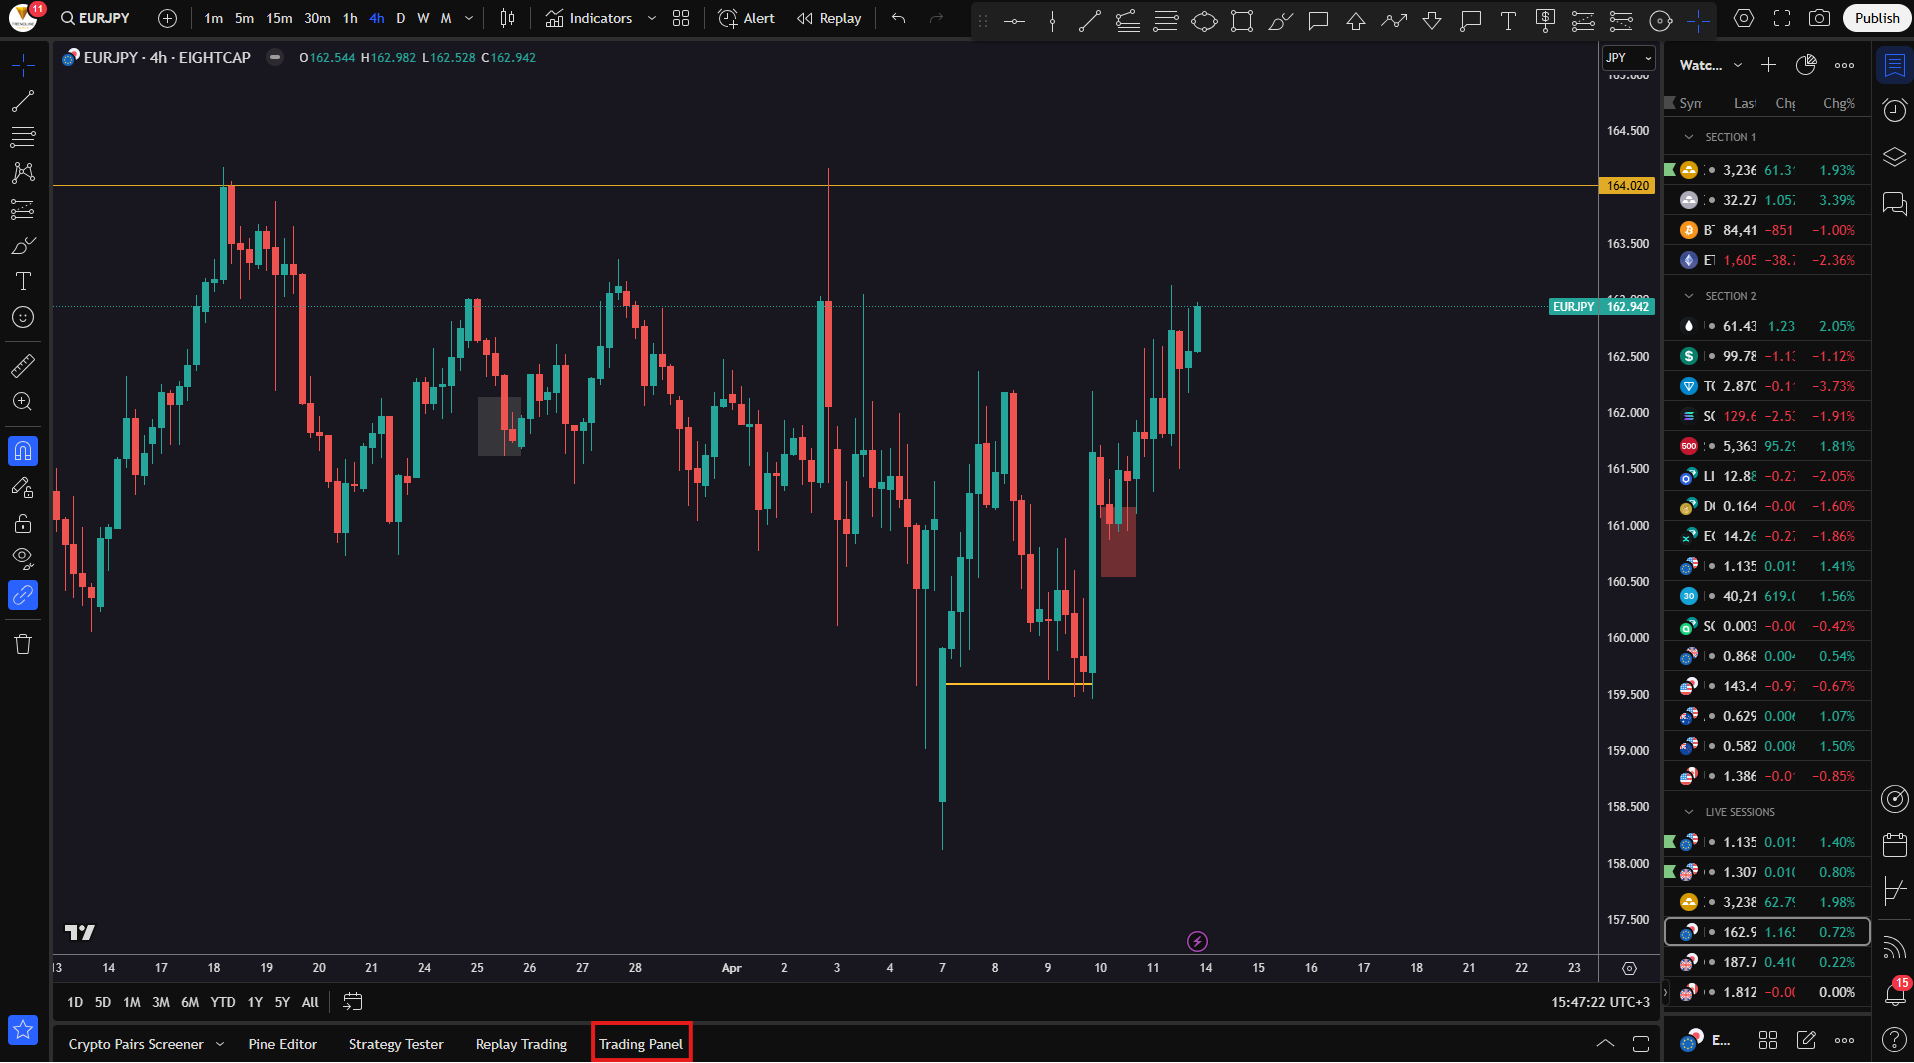
Trading using the TradingView platform
Once you're familiar with the analysis tools in TradingView, it's time to move on to placing trades. You have the option to open real or demo trades through the platform’s supported broker partners.
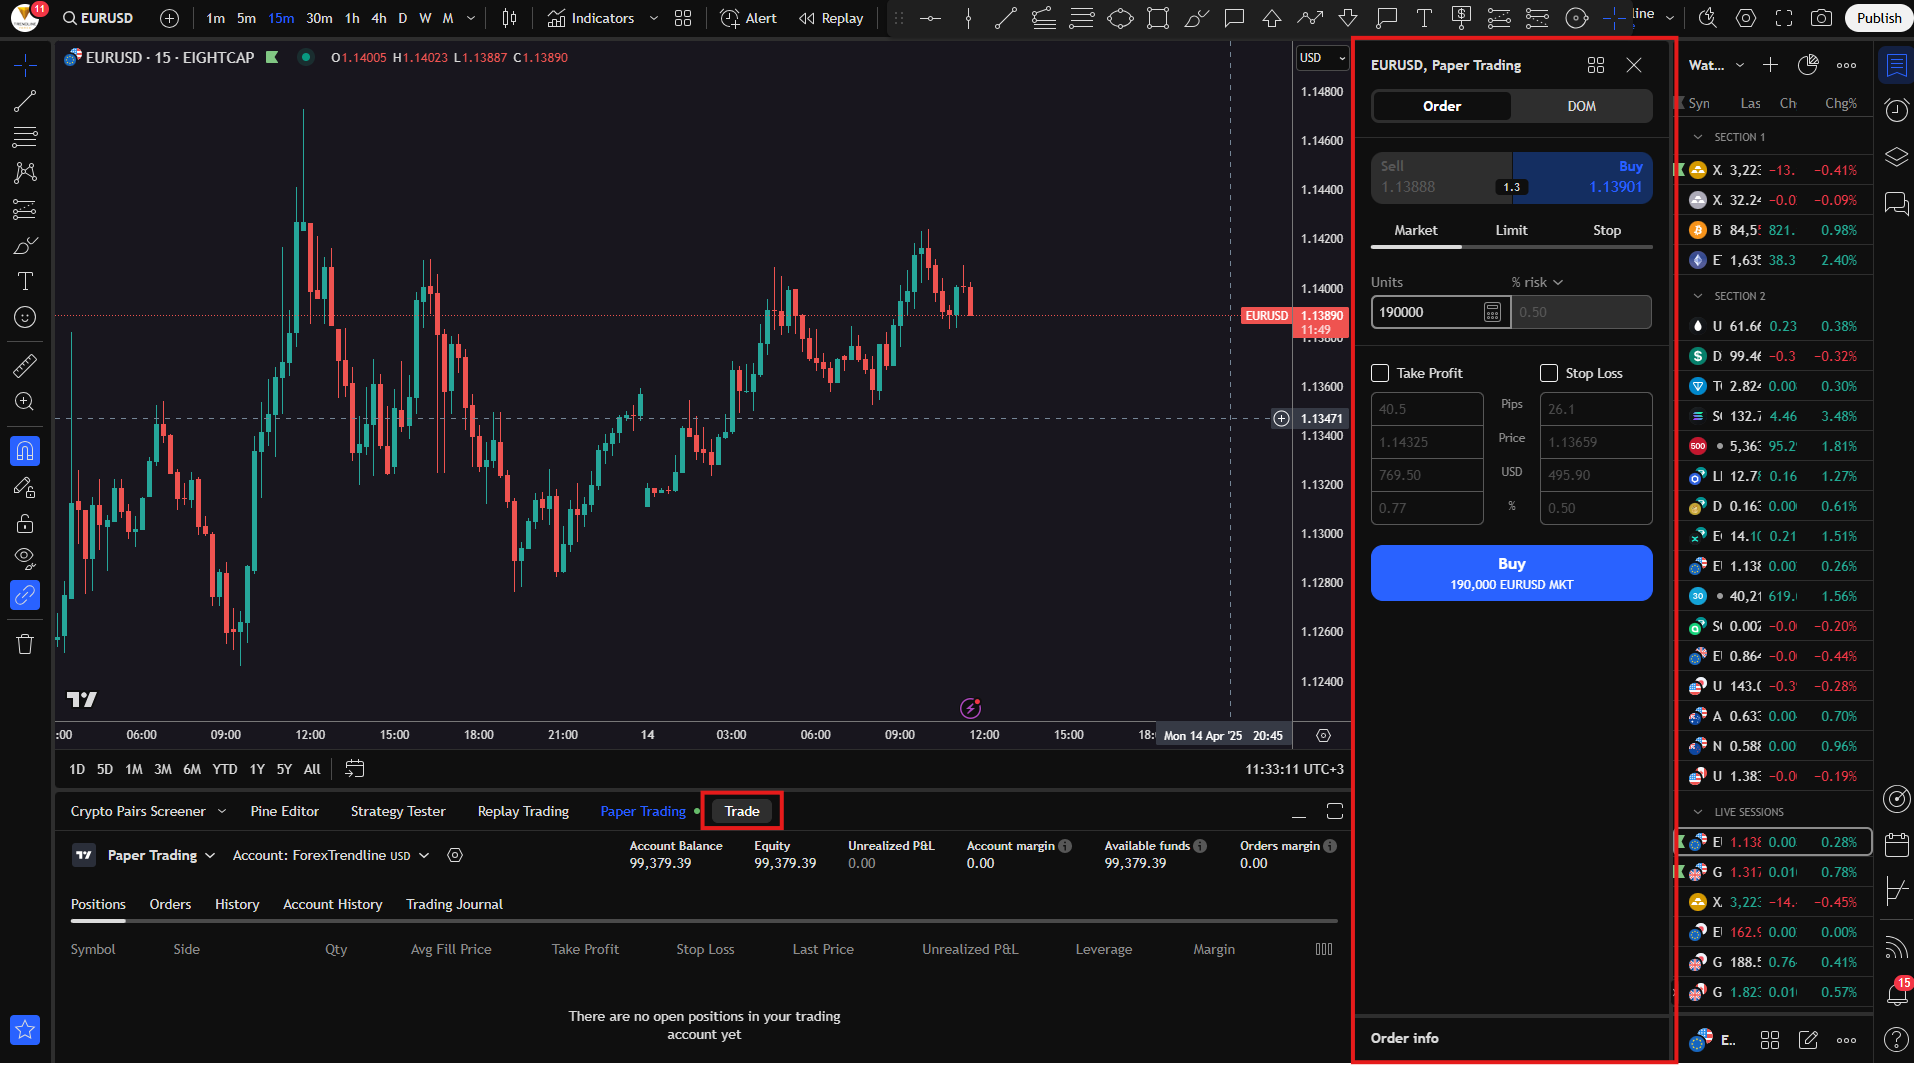
To start trading via TradingView, first open the Trading Panel, located at the bottom of the platform. In the image below, you'll see a red highlight marking its exact position. Once you click it, a panel will appear displaying a list of available brokers. From there, you can connect your account and begin trading directly through TradingView.
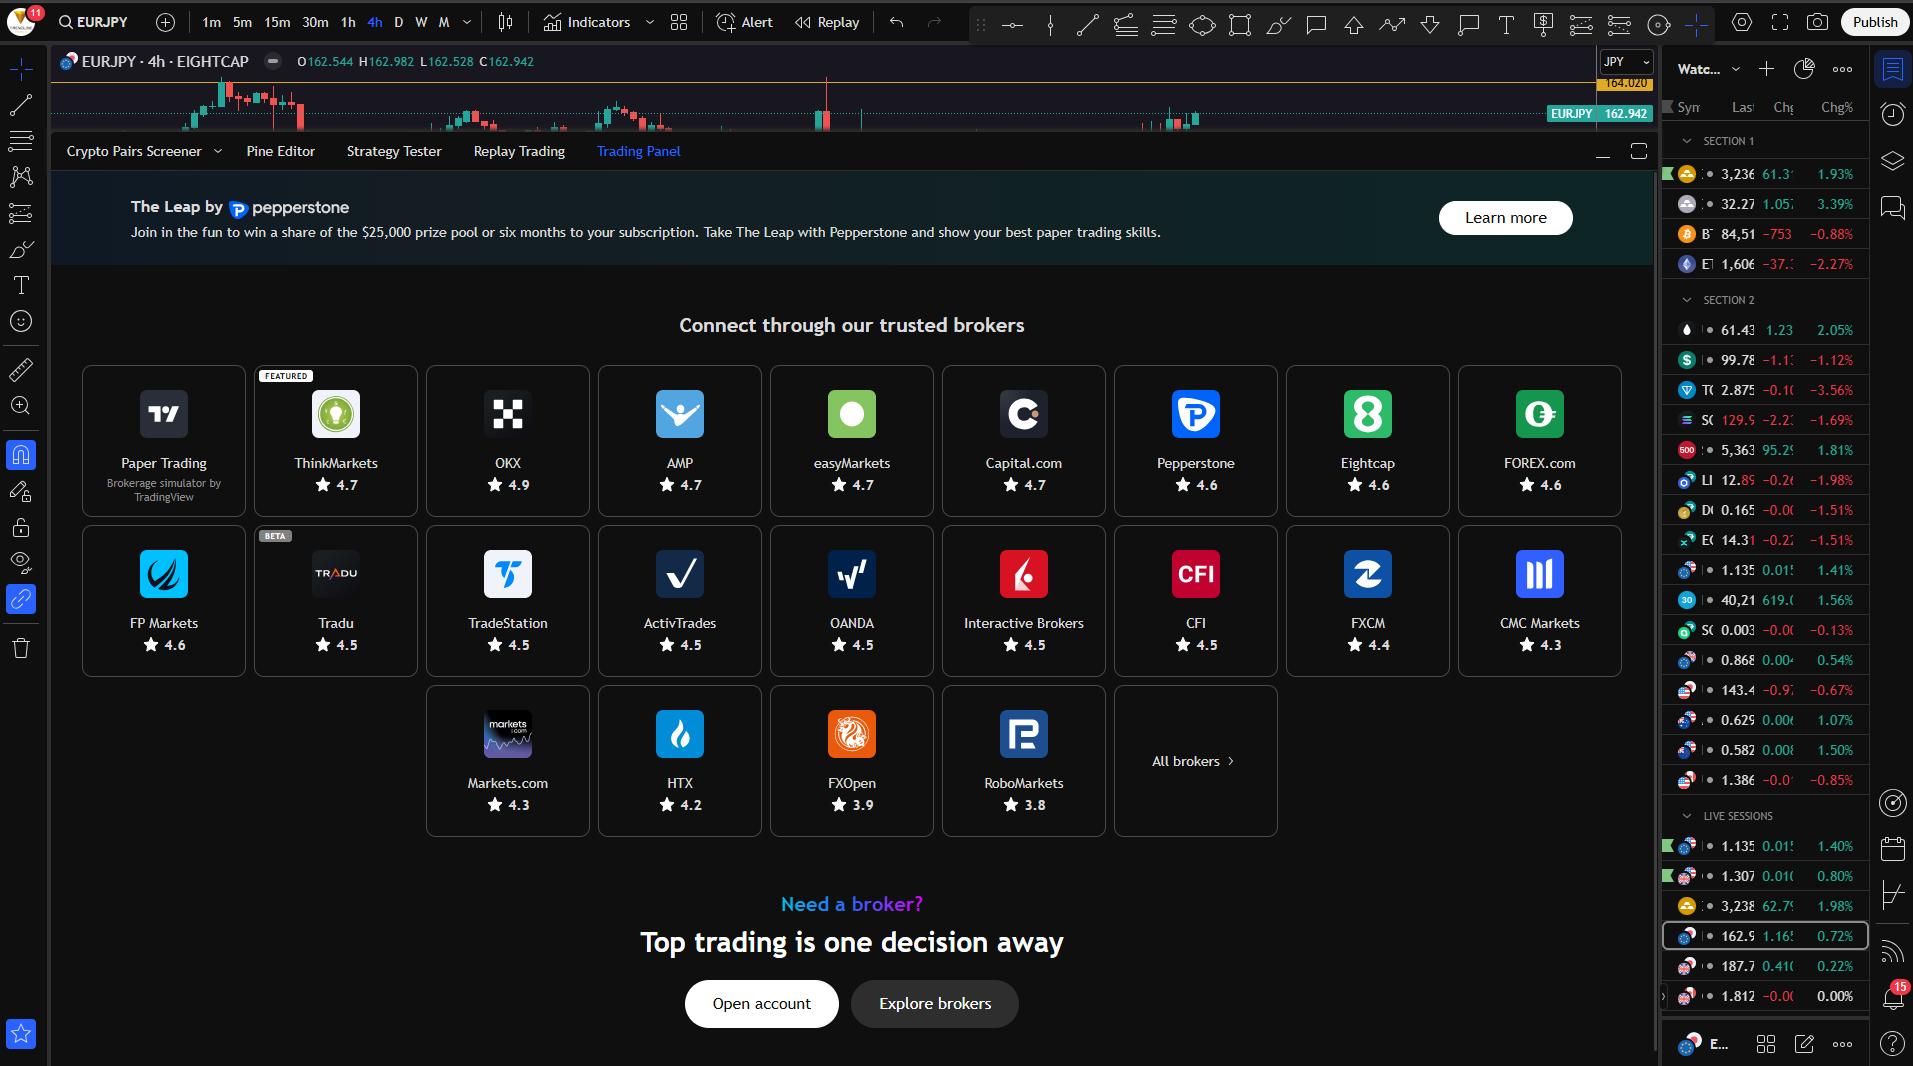
In the image, you can see some of the brokers that offer trading through TradingView. However, there’s also an “All brokers” button that opens up additional options.
You can also make use of TradingView’s “Paper Trading” feature to practice without risking real money.
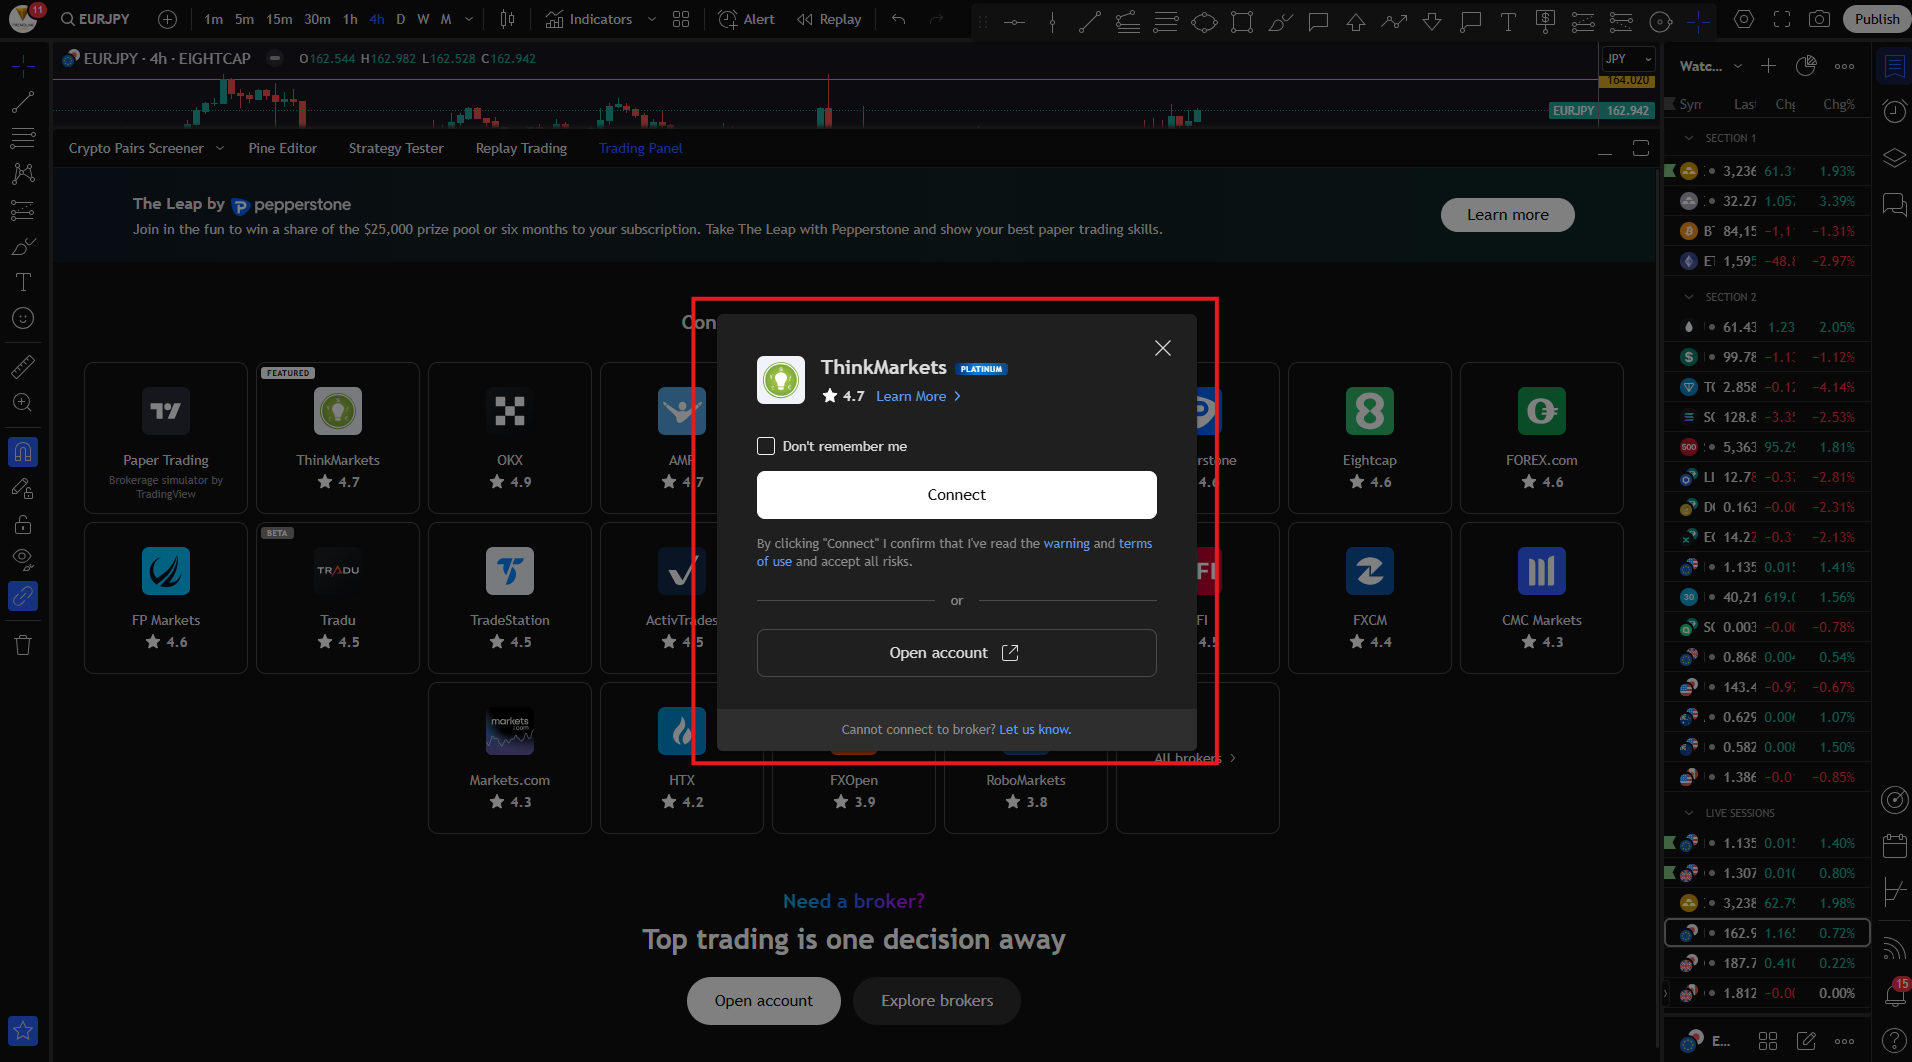
If you have an account with one of the listed brokers, simply click on the broker’s name and connect your account directly to TradingView.
Trading Panel - other features
Here are some additional tools and features available in the Trading Panel on TradingView:
Crypto Pairs Screener
This tool helps you compare different crypto pairs. It allows you to filter and sort cryptocurrencies based on various criteria such as price, volume, percentage change, and more. It’s a great way to quickly identify trading opportunities in the crypto market.
Strategy Tester
With the Strategy Tester, you can backtest trading strategies to see how they would have performed historically. You can adjust parameters like entries, exits, and stop-loss levels to simulate performance and optimize your approach.
Replay Trading
This feature lets you rewind the chart and move through candles step by step. It simulates real-time trading and is ideal for practicing trade execution or testing how you’d react to certain market conditions—without any risk.
Trading Panel
This is where you connect your demo or live account (or use the built-in “Paper Trading” simulator). Once connected to a broker, you can place and manage trades, monitor your portfolio, and execute orders directly from the chart—all without leaving the TradingView platform.
Placing a trade
Click the "Trade" button
You’ll find it at the bottom of your chart, marked in red in the image. Once clicked, a trading panel will open on the right-hand side where you can configure and execute your trade.
Choose your order type
- Market - Executes the trade immediately at the current market price;
- Limit - Executes the trade only if the price reaches a specific level you’ve set;
- Stop - Used to enter a trade when price breaks through a predefined level.
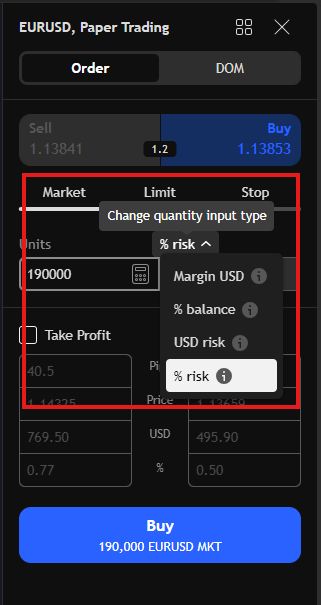
Set your position size
You can choose to risk a fixed amount, a percentage of your account balance, or manually enter the position size if you’ve already calculated it in advance.
Set Take Profit and Stop Loss
Enable the checkboxes for "Take Profit" and/or "Stop Loss". Then enter your desired values — either in pips, specific price levels, or monetary amounts.
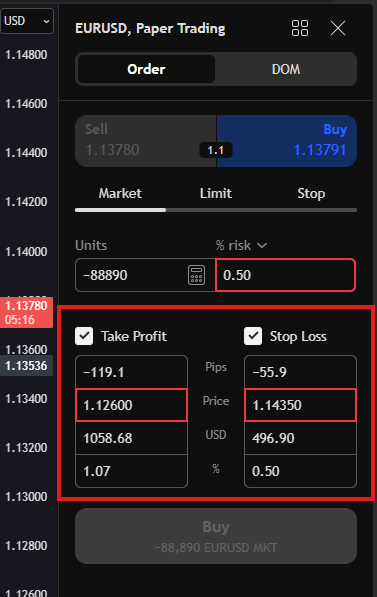
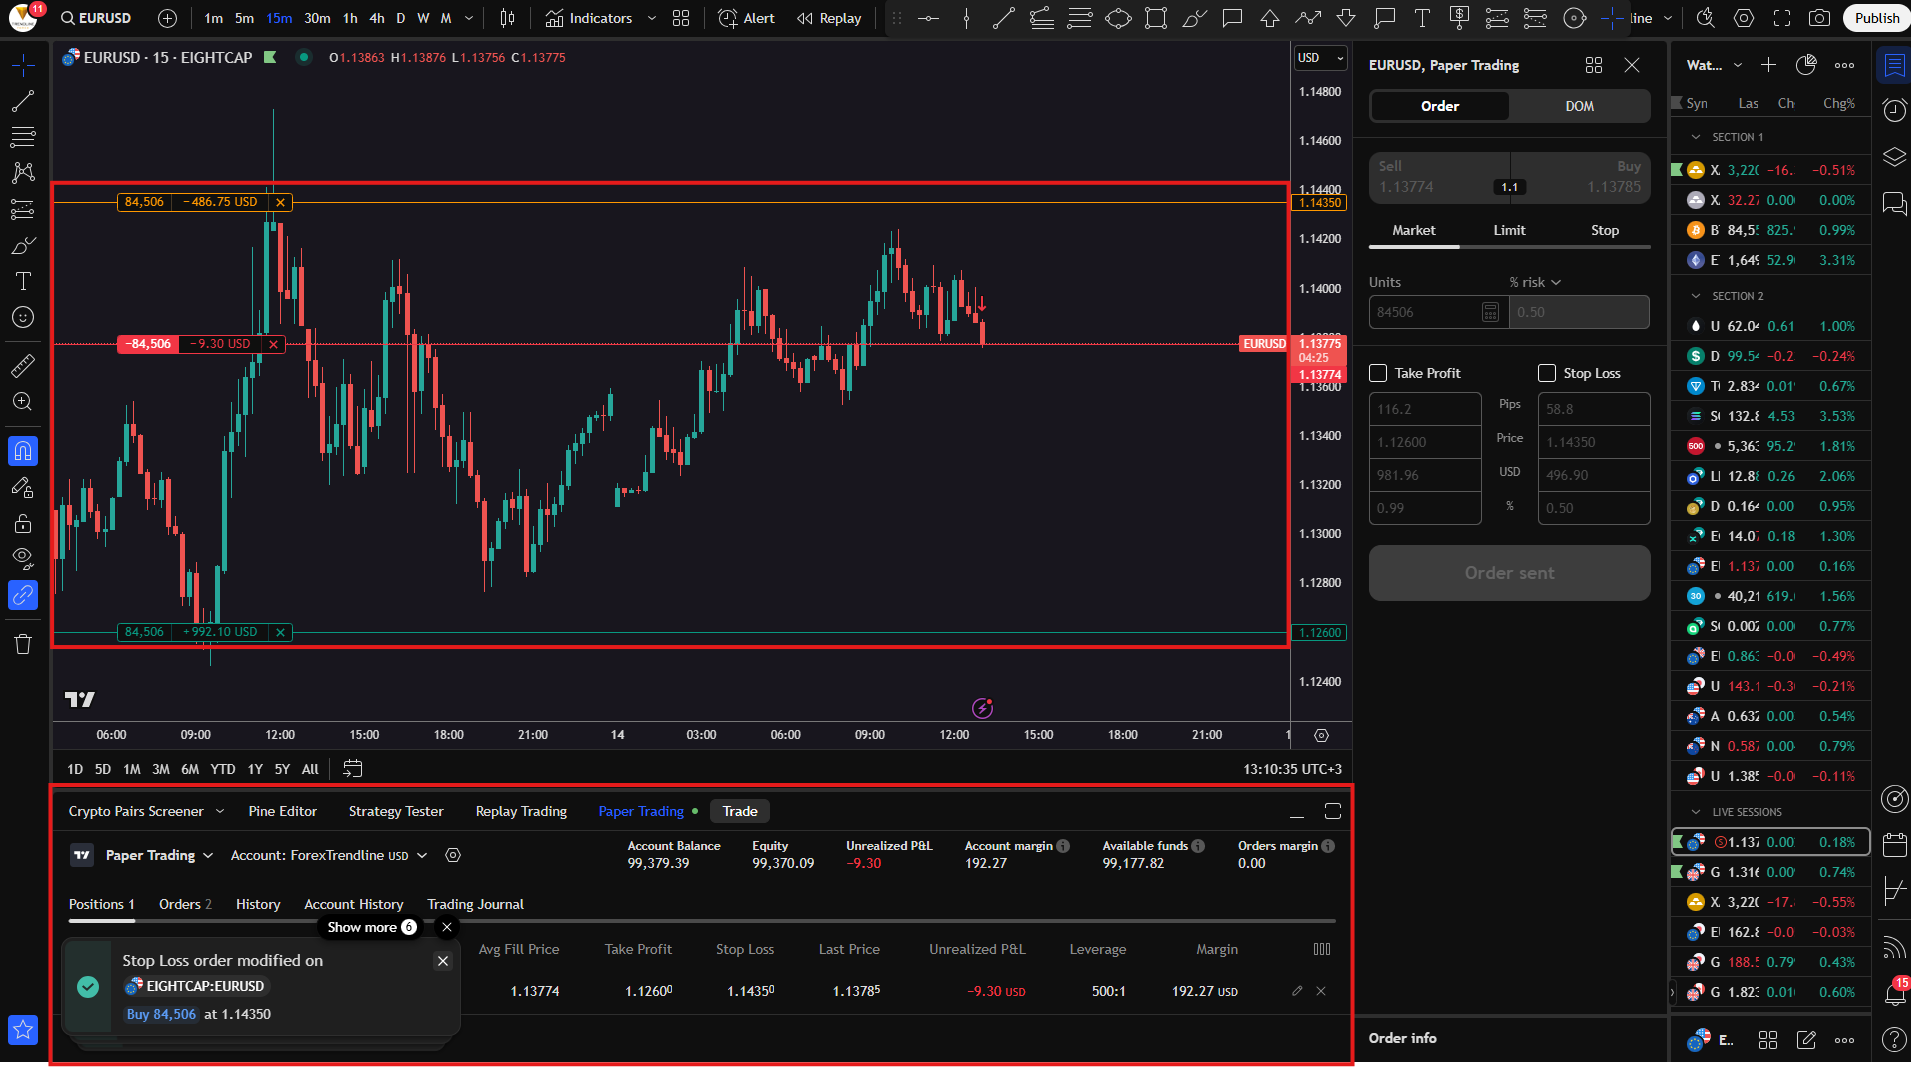
Click the “Buy” or “Sell” button
In this example, we're looking at a sell position on EURUSD. Once the trade is opened, it will appear in the Trading Panel. Additionally, the position will be displayed directly on the chart (as shown in the next image).
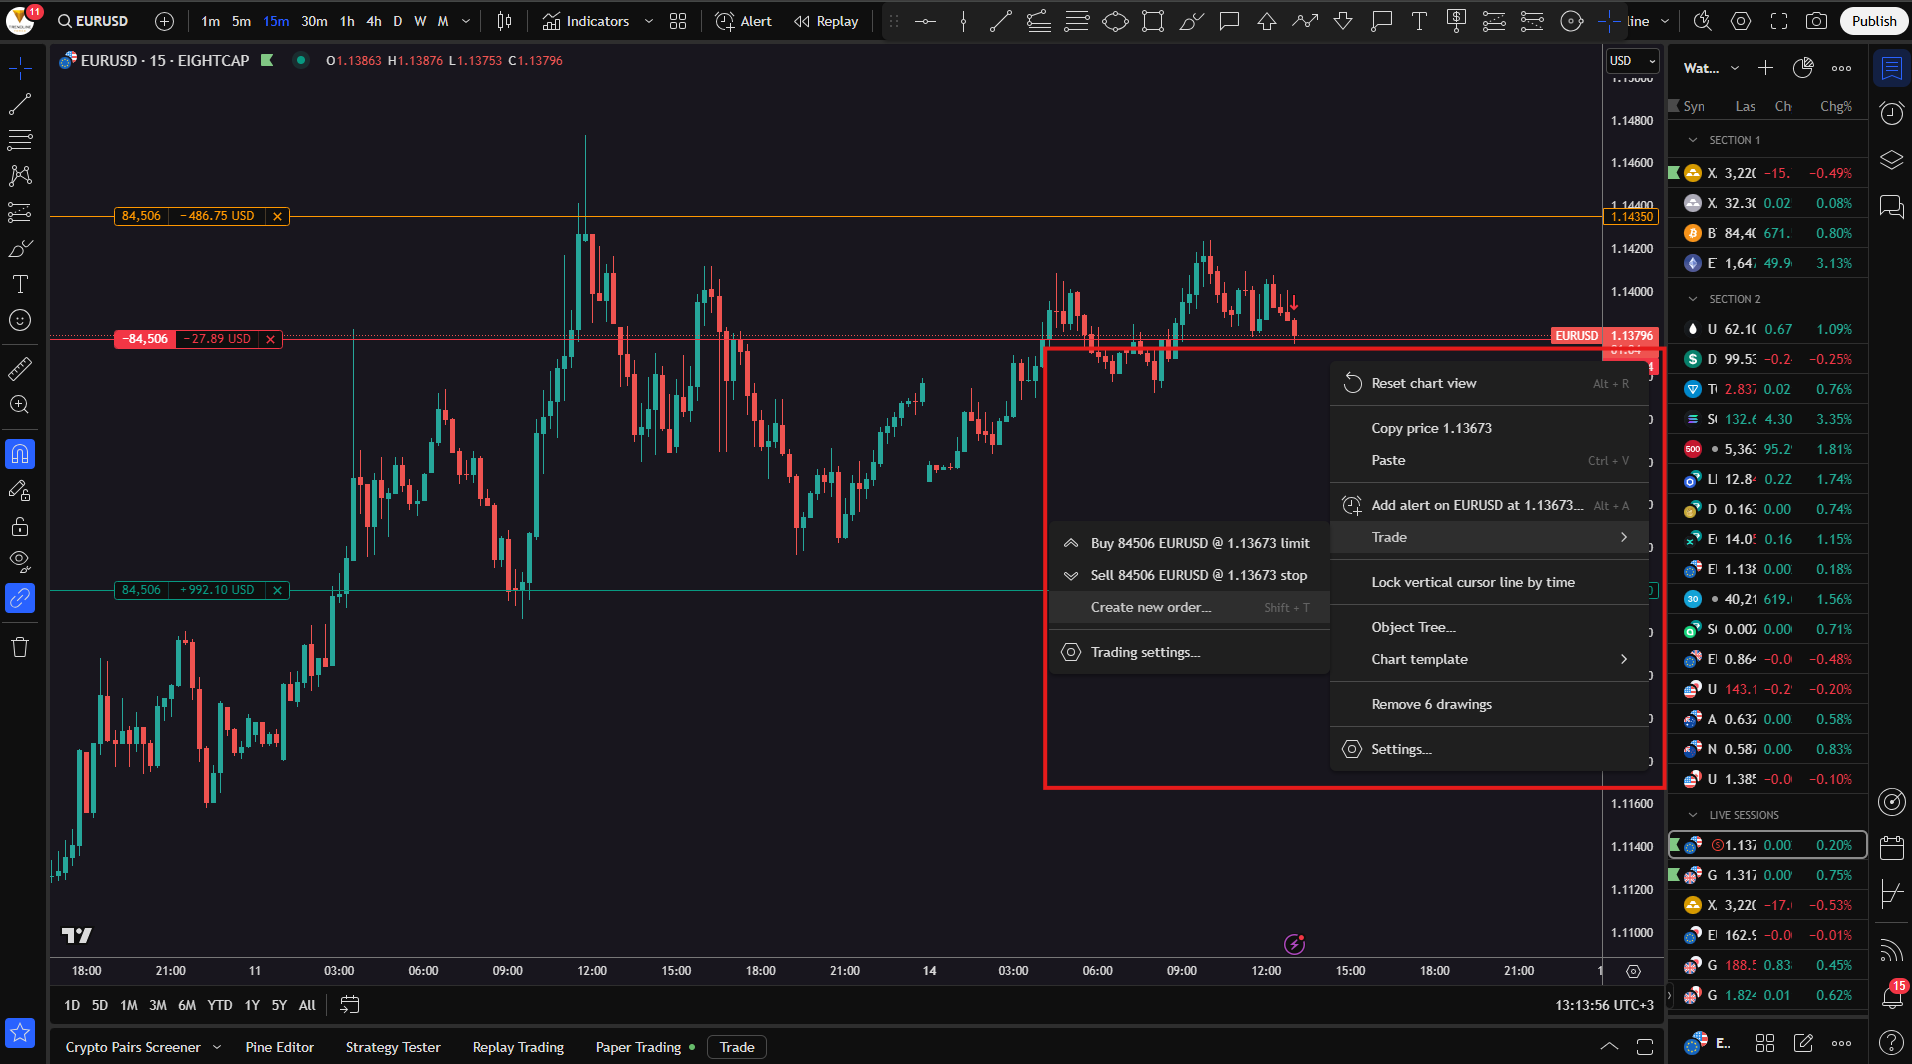
There are several ways to open a trade in TradingView. If you don’t want to use the Trading Panel, you can simply right-click on the chart, then select “Trade”, followed by “Create new order…”.
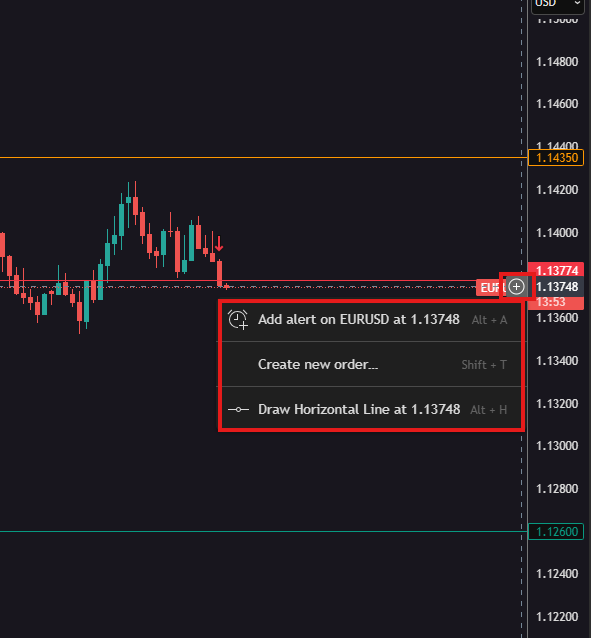
A third way to open a position is by hovering your mouse over the right price scale of the chart. Then, click the “+” button, and once again select “Create new order…”.
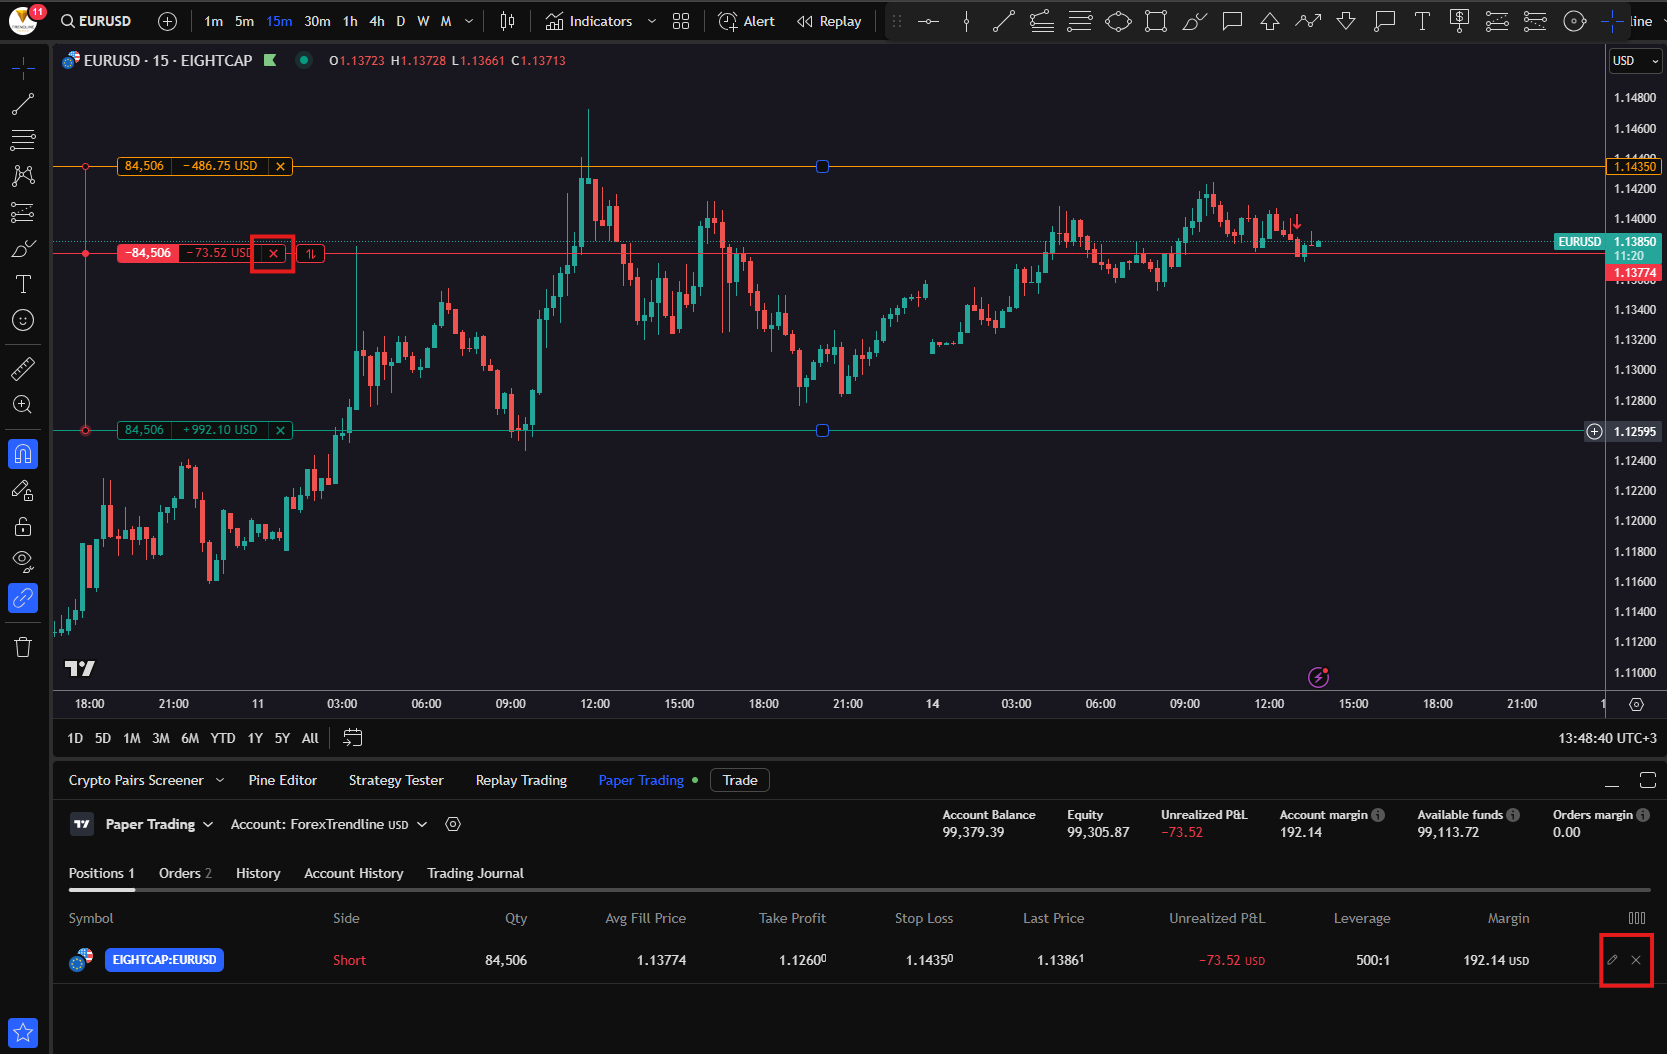
Closing Positions in TradingView
When you decide to close a position manually, instead of waiting for the price to hit your Stop Loss or Take Profit, you can do so by clicking the “X” buttons shown in the image below.
After you click the button, the following menu will appear.
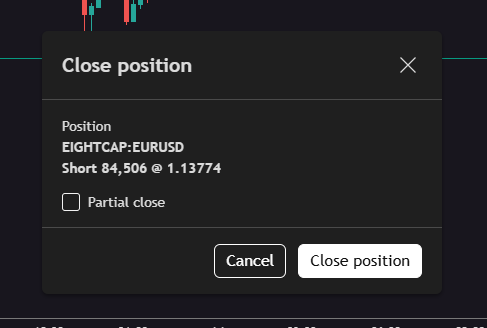
Here, you can choose to close just a part of your position or close the entire position by clicking the “Close position” button.
For each position, you can also use the long and short position tools to better mark your entry and exit levels.
Saving a screenshot this way will help you analyze your results at the end of each week, month, or year.
Conclusion and additional resources
TradingView offers an exceptionally convenient environment for traders, combining analysis, simulation, and live trading - all within a single platform. In this guide, you’ll learn in detail about each key section of the platform, as well as how to easily open positions using the “Trade” button in the trading panel.
To learn more about TradingView’s features and how to use the platform like a professional trader, check out the video linked below.
Using TradingView Like A Pro [Hidden Features]
If you’re still at the start of your trading journey, be sure to go through our completely free beginner’s training.
FREE FOREX TRAINING FOR BEGINNERS
If you want to trade GOLD, FOREX or other instruments and make real profits, our trading course is just for you. A complete beginner's guide in 38 video tutorials.


Risk Warning: Trading involves a high risk of loss and is not suitable for all investors. All products and services offered by "Forex Trendline" Ltd are for educational purposes only and do not constitute investment advice or trading recommendation. Trading in financial instruments carries a high level of risk and may result in losses. Past performance is not indicative of future results. We recommend that you read the full Terms and Conditions before using our website and services offered. Nothing on this website should be interpreted as investment advice from "Forex Trendline" Ltd or any of its representatives, directors, or employees.
© 2026 Trendline. All rights reserved