A few days ago, one of our students, Rosen, sent us something we rarely get: not just a result, but the whole story behind it. We're sharing it here because we think it's more useful to people who are just starting out than any ad we could write.
His Myfxbook curve starts in November 2024. That month he was up 18.40% and, by his own account, was pleased with himself and thought he understood the market. One month later the market answered: a 73.27% drop and an account that was effectively wiped out.
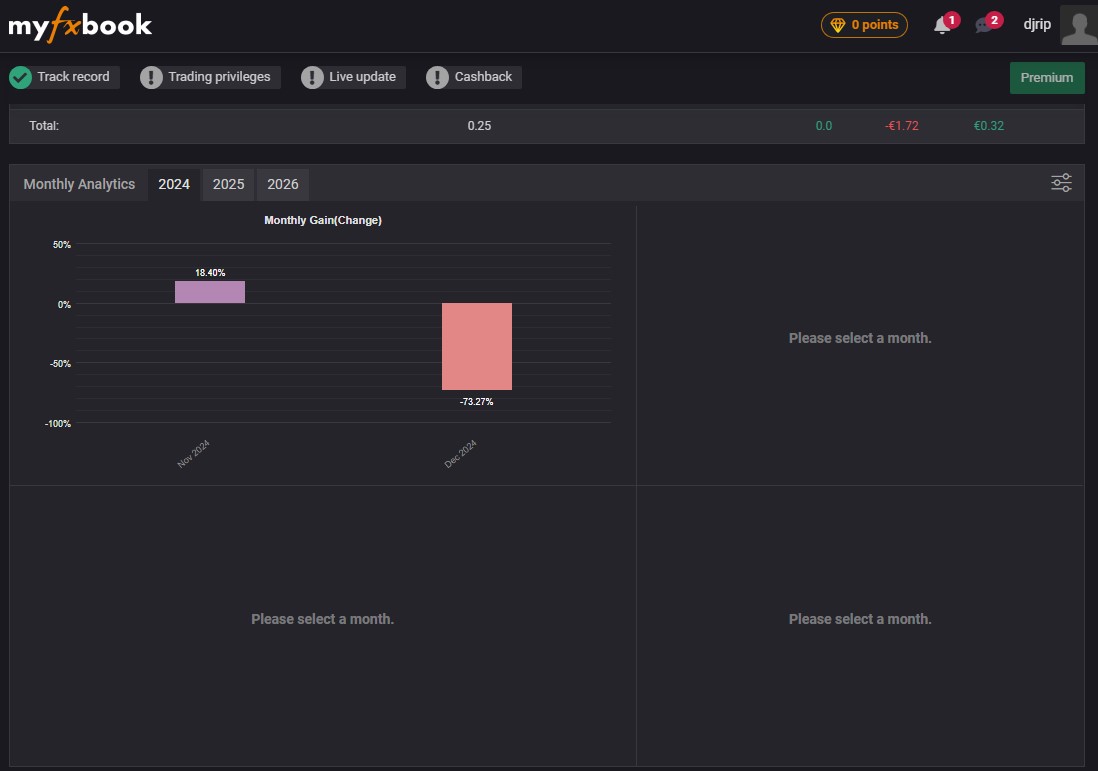
November to December 2024, Myfxbook.
Not because he doesn't understand charts. It's because he did what almost everyone does at the start: sit down in front of the screen thinking today has to produce a certain amount. Trade gold because it's at a high. Switch to EUR/JPY tomorrow because the yen is weak. Then sell EUR/USD because the dollar is strong. Then start scalping because nothing else is working.
That's not a strategy. That's chaos with a live terminal open.
For most people, this is where the story quietly ends: the account gets closed, the person stops trading, and nobody learns anything from what happened. Rosen chose otherwise. After the crash at the end of 2024, he decided to actually study and signed up for our courses.
Here's how he describes the turning point himself:
“That's when I got in touch with you, and you told me about the Telegram group and the daily analyses you do. That gave me direction and made me seriously think through all the mistakes I'd been making before.”
He later joined VTS as well.
Here's what 2025 looked like, month by month, according to his Myfxbook:
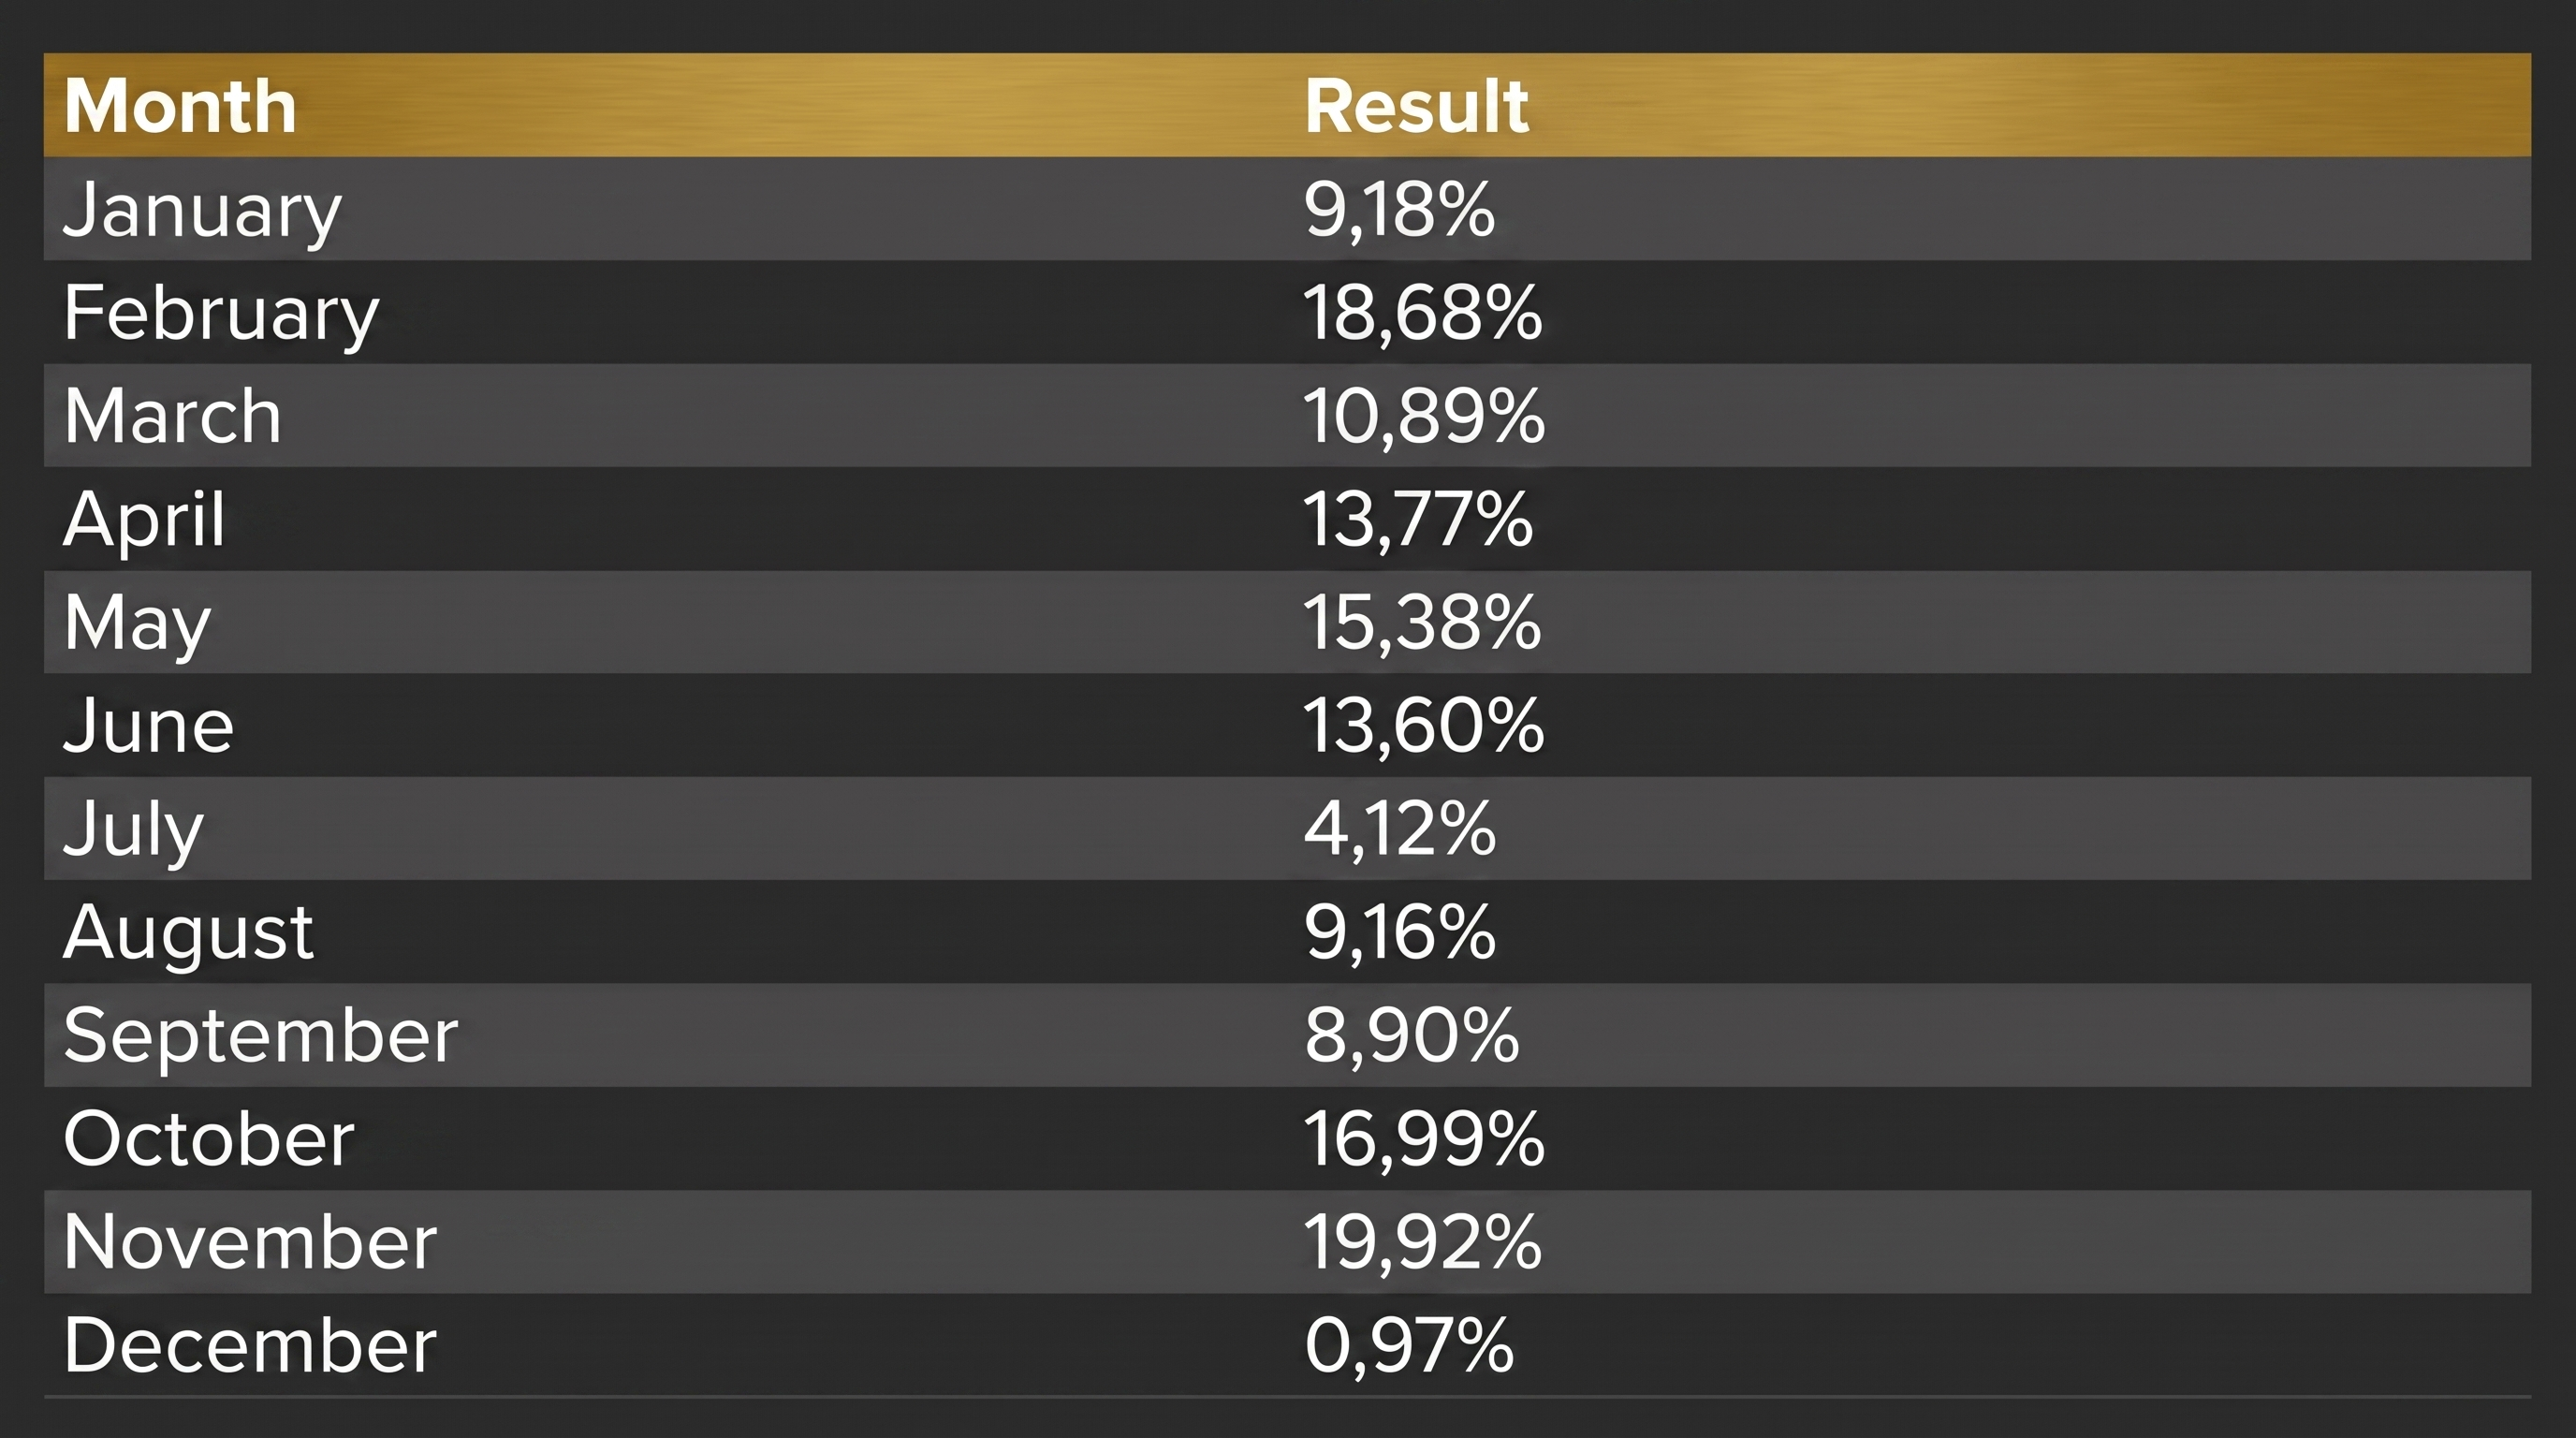
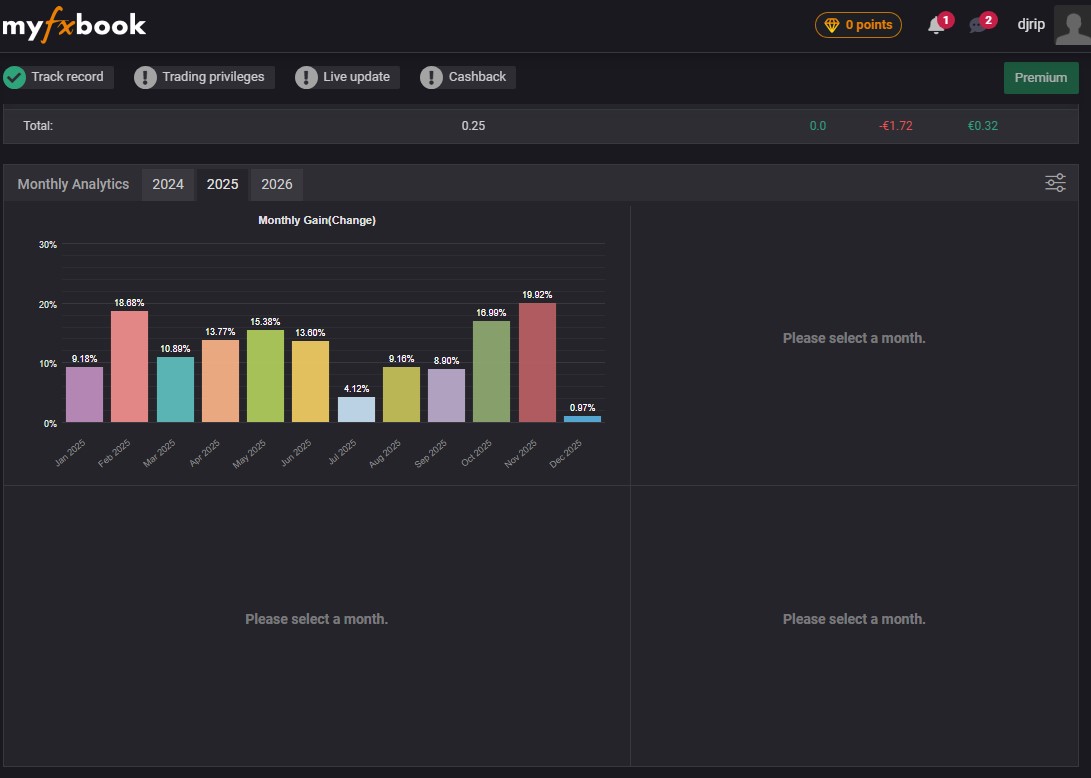
2025, month by month, Myfxbook.
Twelve straight positive months. Not because he'd found a magic formula, but because he stopped looking for one.
2026 hasn't been a clean run, and Rosen doesn't hide that. January 9.21%, February 4.10%, March 29.63%, April minus 11.93%, May 0.78%, June 1.82%, July 9.60%. April is the one that stings most, and it's also the month he talks about most openly, because negative periods are exactly where risk management needs to improve.
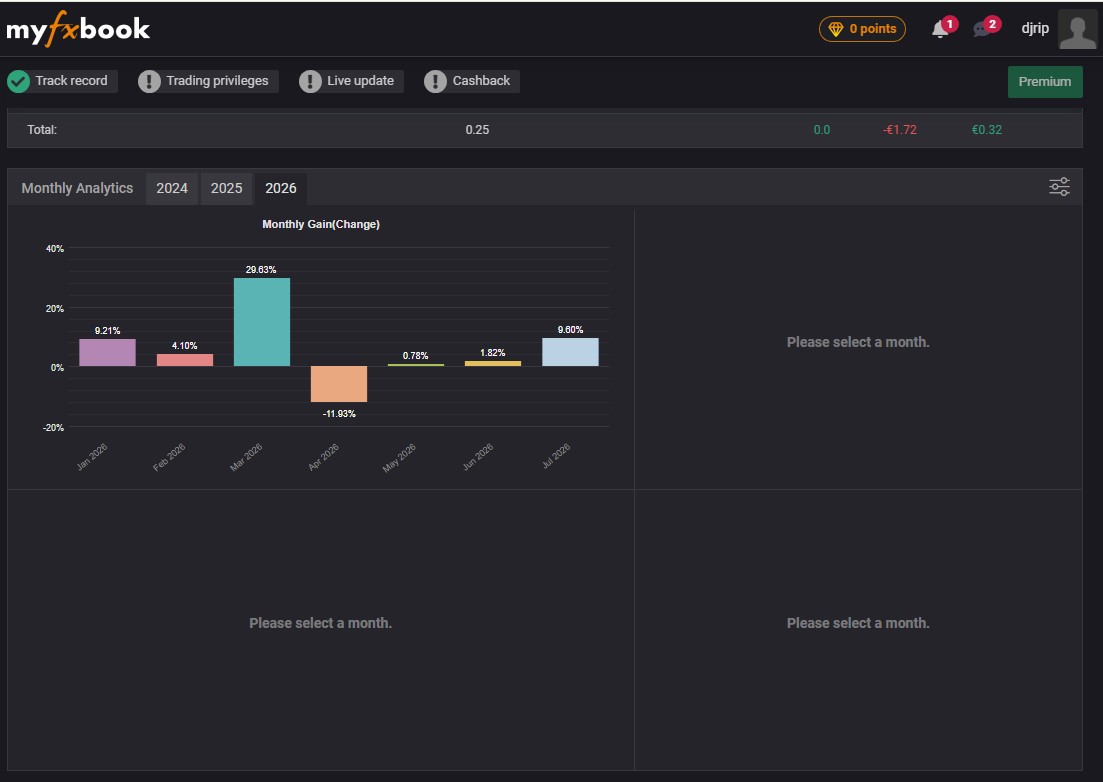
2026 so far, Myfxbook.
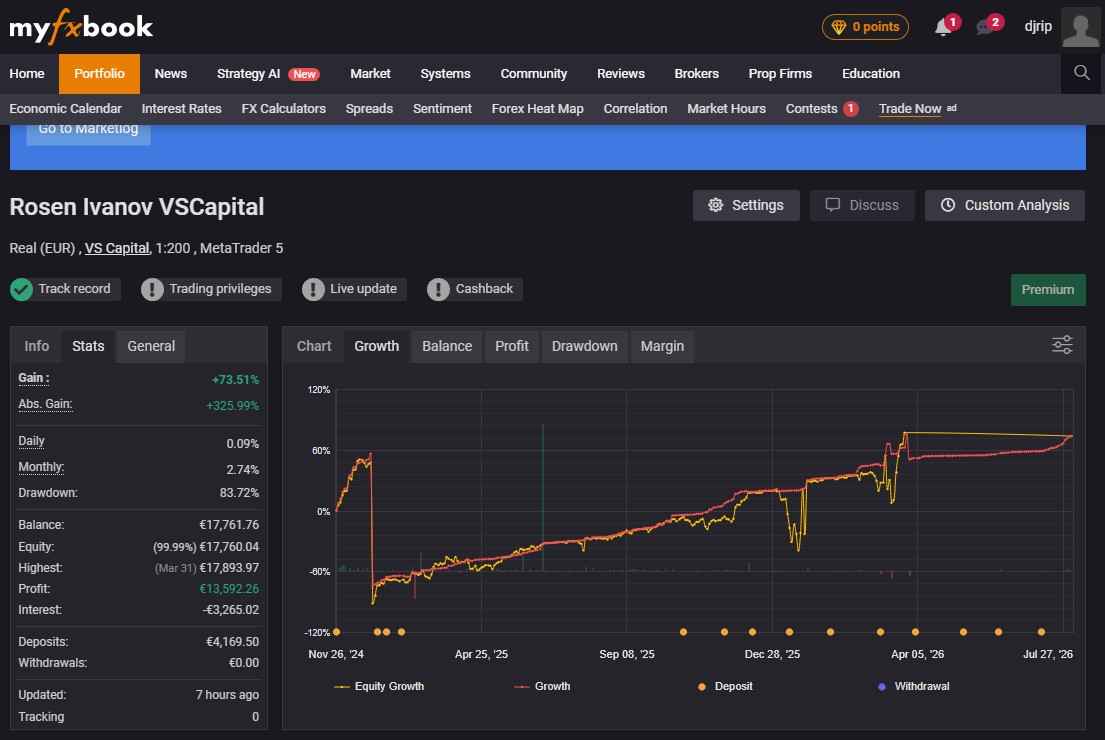
Right now his account shows an absolute gain (Abs. Gain) of 325.99%, that's the Myfxbook metric that reflects the real growth of capital invested, as opposed to the plain gain figure, which is affected by funds added along the way. The balance sits at €17,761.76. But he's the first to point out the number that isn't good: a maximum drawdown of 83.72%. That's the zone where an account can genuinely blow up, and it's exactly what he's working on now, not to make the chart look prettier, but because he knows the result is only good if the risk behind it is under control.
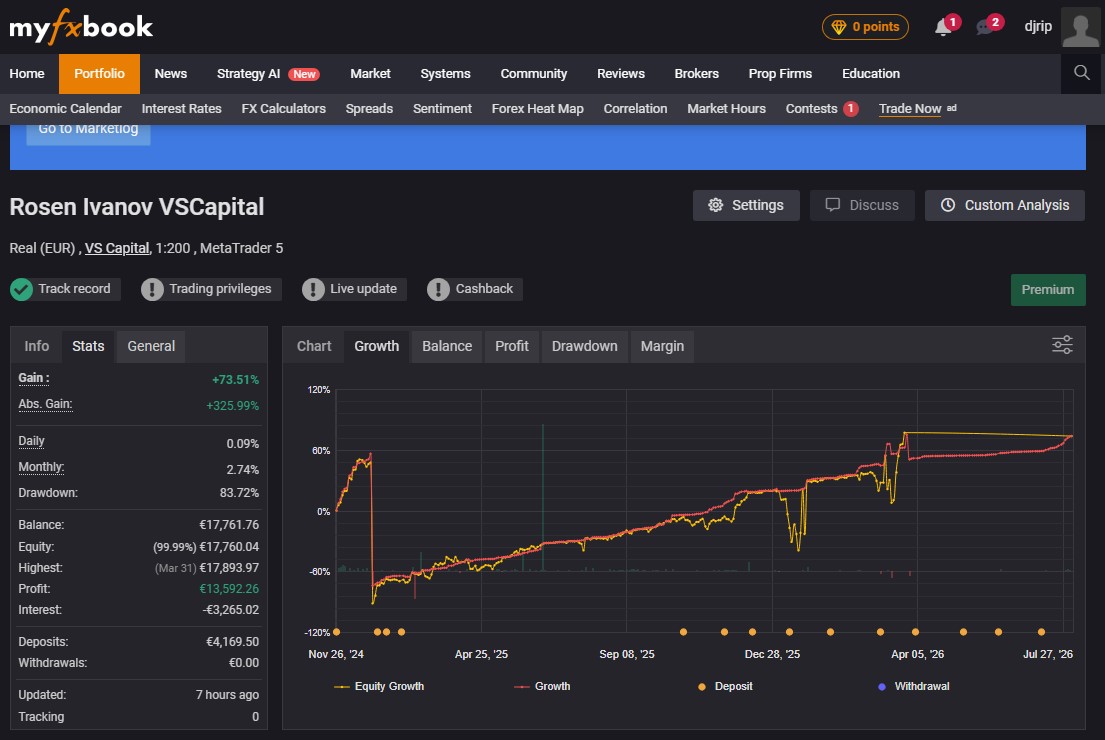
Full growth curve, November 2024 to July 2026, Myfxbook.
We're sharing that number on purpose. Past performance doesn't guarantee future results, and any honest trading story includes the part that isn't perfect.
What changed in his approach
Rosen now trades EUR/USD only, running two separate experts set up for buying and selling, on static entry zones that don't shift with short-term price movement. Before switching them on, he goes through the same prep routine every time: reads the direction on the higher timeframes, marks out the monthly, weekly and daily levels, separates tested from untested zones, knows the maximum number of positions and total volume in advance, and answers the question of what he stands to lose if price runs all the way against him.
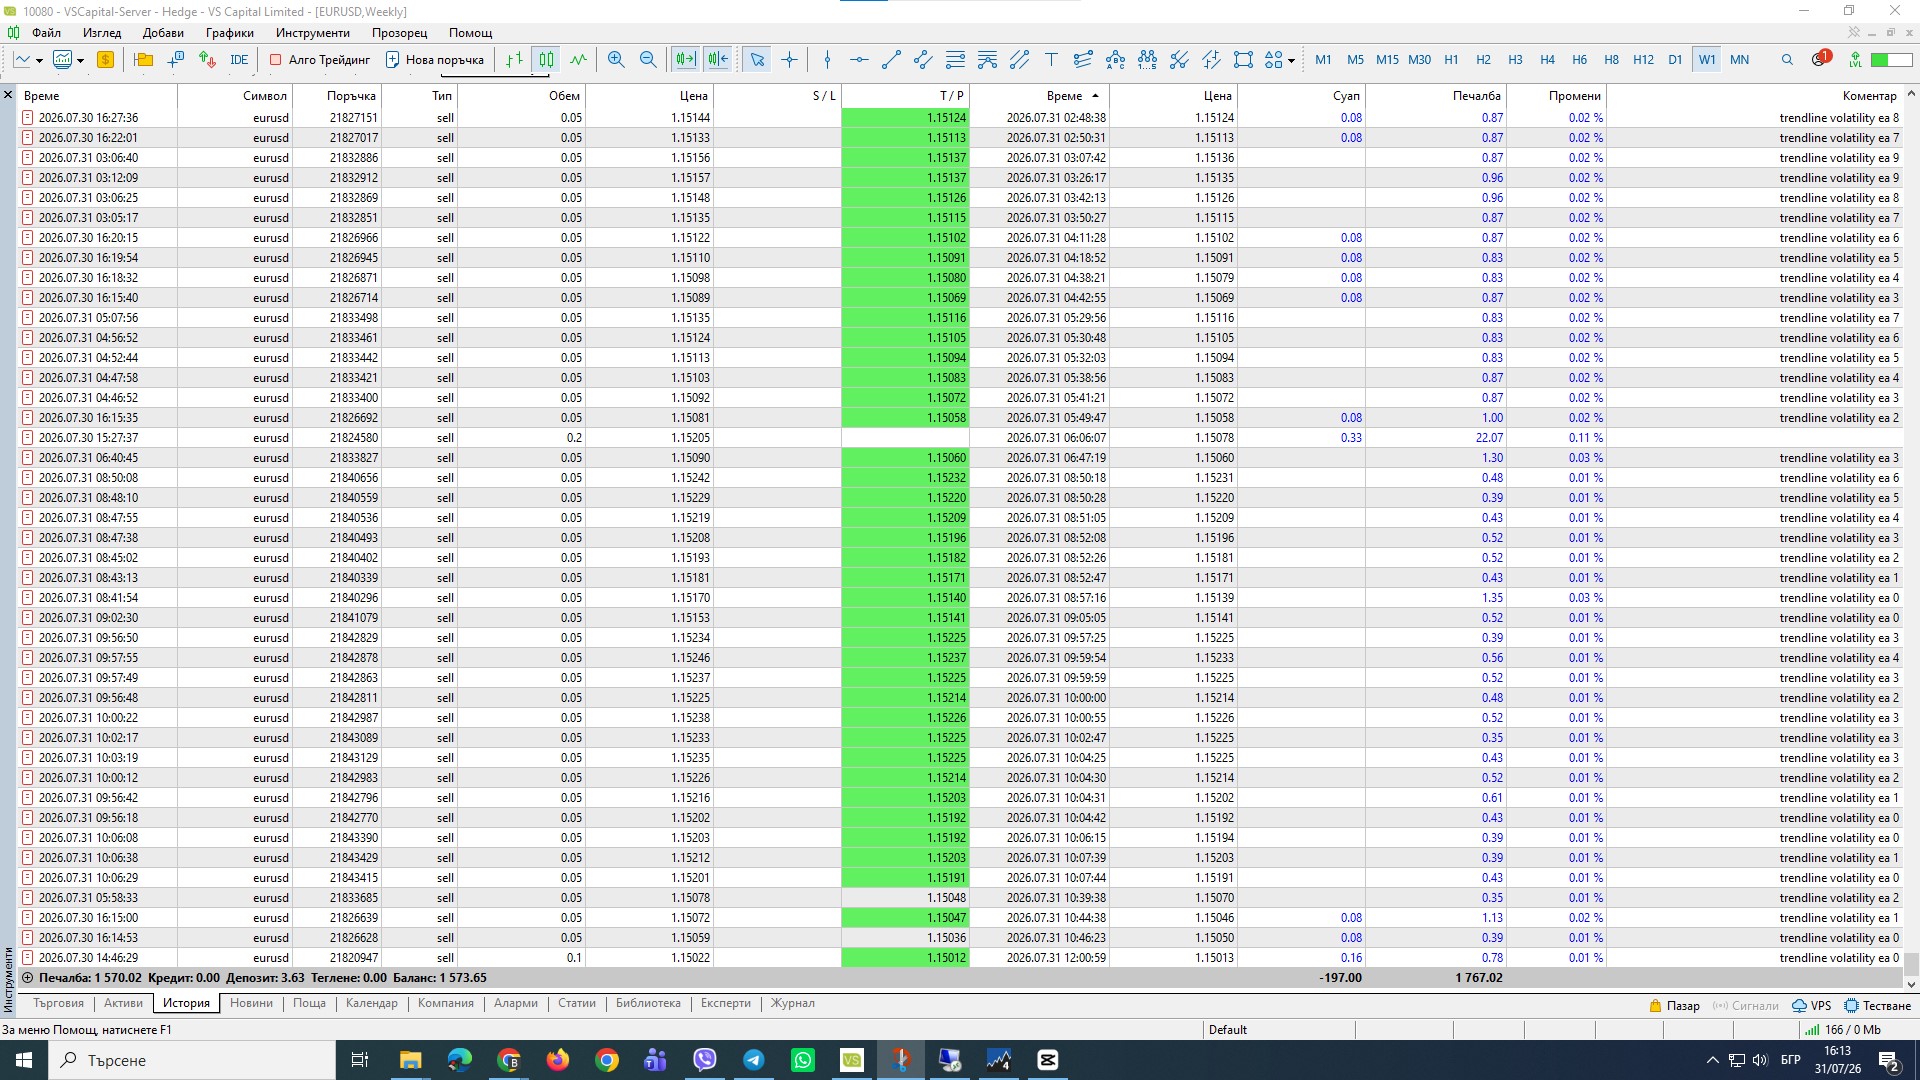
MT5, July 2026 close: net profit €1,570.02.
We asked him which VTS lessons had helped him most, and he listed almost all of them: VTS Settings, Maximum Risk, Best Timeframes, What the Trendline Strategy Is, Determining Direction, Determining Entry, Determining the Entry Zone, Support Levels (the full guide), Exiting a Trade, Chart Setup, Position Management. In his words, he still watches them the way other people watch a series.
Here's what he wrote about them:
“For me, no course is wasted. The material is put together and structured so that when a specific problem comes up, you can find the right topic and a practical solution for it. Whether the issue is psychology, maximum risk, market direction, the entry zone, levels, or managing a position, the courses have a detailed, practical explanation.”
The lessons he keeps coming back to are the ones on maximum risk, determining direction, the entry zone, and the full guide to support and resistance levels. As he puts it plainly: that's the foundation, before he even switches the system on.
He only trades EUR/USD, and almost every example in the courses, support, resistance, trendlines, direction, entry zones, different timeframes, can be traced on that same instrument. Some of the courses were recorded years ago, but for him that's actually one of their strengths: today he can open the EUR/USD chart and see how the principles and levels discussed still hold up. To him, that's proof it isn't about a one-off signal or a single forecast, but a methodology built on market structure and price behaviour.
There's one thing he wrote that's worth quoting almost word for word, because we rarely hear it put this clearly: paying for a course doesn't change your trading, applying what you learned does. He knows plenty of people who bought a course and never got to the end of it. The result doesn't come from the purchase, it comes from doing the work repeatedly.
There's another benefit we don't think about enough when we talk about automation: free time. Since he stopped sitting in front of the chart constantly and reacting to every tick, Rosen has been able to give attention to other things in his life, including his own business.
At the end of his letter he thanked us plainly:
“Thank you for the knowledge, for the daily analyses, and for the way you've structured the courses.”
He adds that there's still plenty of work ahead, but the difference between how he traded in 2024 and how he trades today is already clear.
Why we're sharing this particular story
Because it's real, including the part that doesn't look good. We're not promising that everyone who signs up with us will land twelve green months in a row. Results depend on the trader, on their discipline, and on a market that owes nobody anything. That's why we don't sell signals and we don't offer guarantees.
What we can offer is the structure Rosen arrived at the hard way: one instrument, clear timeframes, pre-marked zones, entry rules, and a maximum risk set in advance. That's exactly what we teach in VTS, the combination of the system, the mentoring courses, and the daily Premium analysis.
If you recognise yourself at the start of this story, in the month where you switch strategy every time the market turns against you, this is a good moment to take a look at what we offer.
👉 See VTS





Risk Warning: Trading involves a high risk of loss and is not suitable for all investors. All products and services offered by "Forex Trendline" Ltd are for educational purposes only and do not constitute investment advice or trading recommendation. Trading in financial instruments carries a high level of risk and may result in losses. Past performance is not indicative of future results. We recommend that you read the full Terms and Conditions before using our website and services offered. Nothing on this website should be interpreted as investment advice from "Forex Trendline" Ltd or any of its representatives, directors, or employees.
© 2026 Trendline. All rights reserved